
Radial Pulse Wave Analysis in Young Male Elite Athletes
 , José Alfie2, Gustavo Blanco1, Cecilia Resina1, Meschino Gustavo3, , Mariana Fita1
- DOI
- 10.2991/artres.k.201208.001How to use a DOI?
- Keywords
- Augmentation index; central pressure; pulse wave velocity; pulse pressure; diastolic amplitude
- Abstract
Background: Indicators obtained from the analysis of the radial pulse wave allow an indirect evaluation of the interaction between cardiac ejection and arterial walls.
Objectives: To analyze the characteristics of the arterial pulse in young elite athletes through a cross-sectional observational study.
Methods: We evaluated the radial pulse wave in 35 high performance young male athletes, who practice various sports, comparing them with 36 healthy men of similar ages, using the applanation tonometry technique. We computed conventional indicators of central increase in central pressure and aortic propagation velocity, and added two new indicators: the slope of the increase in radial pressure and the amplitude of the oscillatory component during diastole.
Results: In relation to controls, athletes exhibited lower heart rate (61.6 ± 9.1 vs. 71.4 ± 10.6 bpm, p < 0.001), lower pulse wave velocity (7.0 ± 1.0 vs. 7.5 ± 0.8 m/s, p < 0.001), lower diastolic blood pressure (67.6 ± 8.2 vs. 78.5 ± 7.3 mmHg, p < 0.001) and higher brachial pulse pressure (53.6 ± 8.3 vs. 46.7 ± 7.1 mmHg, p < 0.001). The systolic slope (0.70 ± 0.15 vs. 0.59 ± 0.13 mmHg/ms, p < 0.001) and the amplitude of diastolic oscillation (25.7 ± 6.4 vs. 18.4 ± 4.7%, p < 0.001) were significantly higher in athletes than in controls.
Conclusion: Young athlete presented low aortic velocity, but significantly higher systolic slope and diastolic oscillation amplitude than controls. The steeper systolic slope and the lower diastolic blood pressure could underlie a higher stroke volume and a lower peripheral resistance respectively. The greater diastolic oscillation could be the consequence of the eccentric remodeling and increased compliance of the distal arteries, in response to intense training. We propose new pulse wave parameters obtained from the analysis of the radial waveform for the assessment of the cardiovascular adaptation to intense training.
- HIGHLIGHTS
- •
Pulse wave contour of athletes is characterized by a steeper pressure slope and greater diastolic oscillation.
- •
In contrast, traditional tonometric indicators did not differ significantly between athletes and controls.
- •
The cardiovascular adaptation to high performance training could be evaluated by pulse wave analysis.
- •
- Copyright
- © 2020 Association for Research into Arterial Structure and Physiology. Publishing services by Atlantis Press International B.V.
- Open Access
- This is an open access article distributed under the CC BY-NC 4.0 license (http://creativecommons.org/licenses/by-nc/4.0/).
1. INTRODUCTION
Intensive training produces remarkable changes in the cardiovascular system. There are two general types of intensive training: endurance training, and strength training. Endurance training is based on developing moderate effort for a long time, improving the capacity of the aerobic system. In strength training, very intense efforts are developed for a short time, stimulating muscle development and anaerobic metabolism. The effects of training on the cardiovascular system are diverse, and would depend on its type, intensity, and duration.
The analysis of the contour of the radial pressure wave allows us to estimate aortic Pulse Wave Velocity (PWV), central or aortic systolic blood pressure and the radial augmentation index [1].
Previous reports showed no difference in the systolic contour, defined by the augmentation index, between athletes and healthy controls [2,3]. However, visual inspection of the morphology of the athletes’ waveforms, indicated remarkable differences during diastole, in relation to healthy controls. The amplitude of the damped oscillation that occurs during diastolic decay was much greater than that of the controls, altering the contour of the pressure wave. This oscillation depends on the compliance of the distant muscular arteries, which is increased by training. Furthermore, by plotting the records in absolute pressure values (mmHg), it was evident that the rise in systolic pressure (mmHg/s) was faster in athletes than in controls. This rise depends on the stroke volume and the aortic impedance on which it occurs. Based on these observations, it was decided to study the characteristics of the arterial pulse in a group of elite athletes, especially the rise in Systolic Slope (SS) and the Diastolic Amplitude (DA), comparing them with those obtained in healthy individuals of similar age.
2. MATERIALS AND METHODS
We recruited 35 normotensive young male “high performance” athletes volunteered for this study, ages between 14 and 35, and playing different sports. These athletes compete nationally and internationally, having sporting achievements, and more than 3 years of training at least six times a week for 3 h a day. Most were swimmers (66%), and the rest practiced running, jumping, rowing or soccer. They were considered together because no significant difference was subsequently found in their main arterial indicators, and they had standard comprehensive medical studies that enabled them for intensive training.
Women were not included because their anthropometric and hormonal characteristics influence the arterial indices and therefore would be considered separately [4].
We also included a control group of 36 healthy males of comparable age, Body Mass Index (BMI), and normal biochemical controls. All of them were students and were under mandatory medical supervision, including chest radiography, electrocardiogram, and clinical analysis. None of the participants reported being cigarette smokers or drinking alcohol on a daily basis, nor having chronic illnesses.
The study was carried out under institutional control, and respecting bioethical rules, which included written consent, confidentiality and personal communication of the results.
Two 1-min records of the radial pulse were evaluated for each study, and they were taken in the afternoon (5 pm Argentina time), at sportive practices place and prior to it, after 15 min of rest in the sitting position, with the arm supported at heart level. They were processed averaging eight beats.
Tea, coffee and food intake were not allowed in the two previous hours. Brachial blood pressure was measured auscultatory with a periodically calibrated aneroid sphygmomanometer (Heine, Gamma 4.0), using the average of three readings taken at 1 min intervals. The peripheral pulse wave was evaluated non-invasively by applanation tonometry in a sitting position, using a standard piezoelectric pressure transducer (Murata 7BB-12-9) applied at the radial palpation site, which provides repeatability of 2.25% in the amplitude measurement. Times were measured with an accuracy of ±2.5 ms.
Figure 1 illustrates the radial pulse waveform record for an adult male, normalized in amplitude (0–100%), with the main variables exposed.
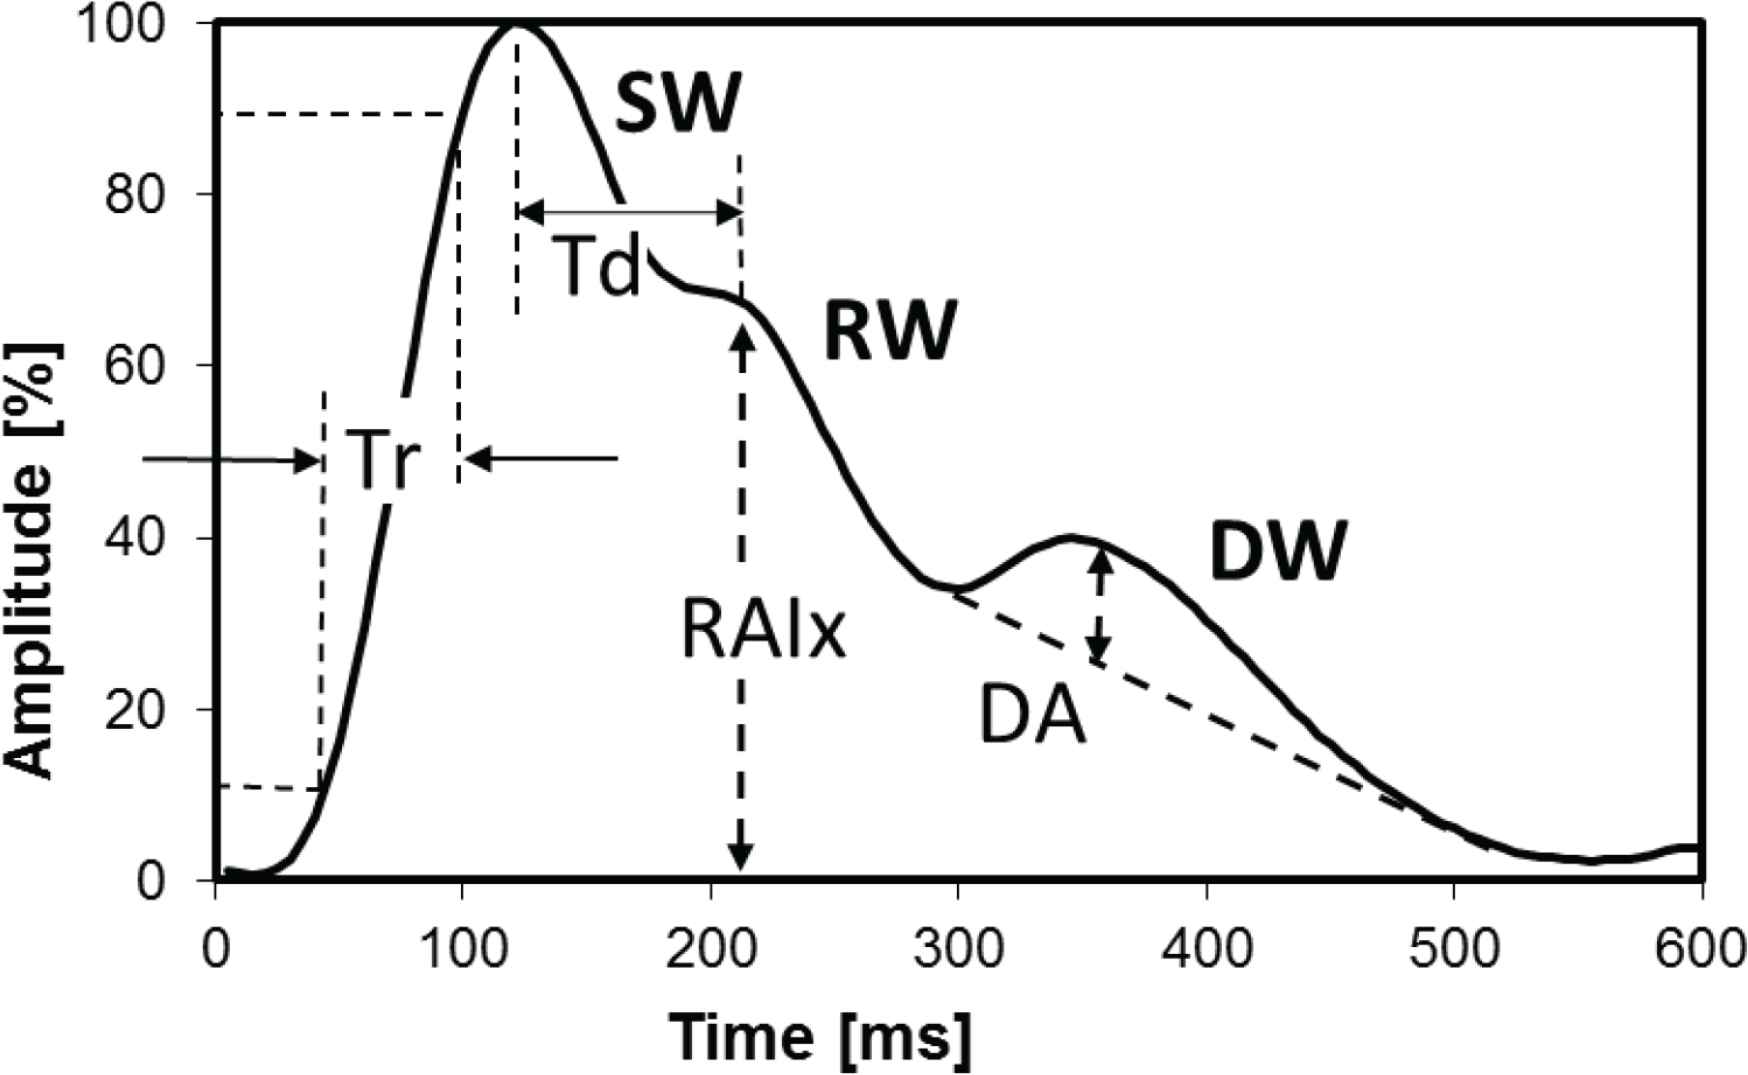
Radial pulse wave register normalized in amplitude: The Systolic Wave (SW) and the Diastolic Wave (DW) are separated by the dicrotic notch. The wave reflected in the abdominal aorta Reflected Wave (RW) can be seen on the SW descent slope.
Indicators obtained from the analysis of the radial pulse wave were calculated as follows:
- •
The arrival delay time Td is the difference between maximums of the systolic wave and the reflected wave [5]. It corresponds to the time taken by the aortic pressure wave to reach the reflection zone and return to the ascending aorta [6]. Taking into account the body height, Td allows calculating the PWV [7].
- •
The Radial Augmentation Index (RAIx) is the height of the reflected wave (RW) [5]. Depends on Td and RW amplitude.
- •
The Central Systolic Blood Pressure (CSBP) was calculated from RAIx and brachial blood pressure [1].
- •
Peripheral Amplification (PA) was calculated by subtracting Brachial Systolic Blood Pressure (bSBP) and CSBP.
- •
The rise time (Tr) is the lapse required for the systolic pressure to rise from 10% to 90% of the maximum value.
- •
The SS is the increase in pressure during Tr.
- •
In order to evaluate linear dependence between variables, Pearson correlation coefficients and their corresponding significance values were considered with p < 0.05 as significant. The influence of high performance training on systolic slope and diastolic amplitude, and its independence from possible confounders, was evaluated by multiple linear regression analyses.
3. RESULTS
As shown in Table 1, athletes presented similar age and body height, with lower mean BMI than controls (p = 0.097). They also presented significantly lower Brachial Diastolic Blood Pressure (bDBP) (p < 0.001), similar bSBP (p = 0.130), with significantly lower Heart Rate (HR) (p < 0.001), higher Brachial Pulse Pressure (bPP) (p < 0.001).
| Athletes | Controls | p-value | |
|---|---|---|---|
| N (cases) | 35 | 36 | – |
| Age (years) | 19.9 ± 7.3 | 20.4 ± 3.1 | 0.550 |
| Height (m) | 1.74 ± 0.1 | 1.77 ± 0.06 | 0.281 |
| BMI (kg/m2) | 22.5 ± 3.5 | 24.0 ± 3.7 | 0.097 |
| bSBP (mmHg) | 120.9 ± 8.0 | 125.3 ± 11.2 | 0.130 |
| bDBP (mmHg) | 67.6 ± 8.2 | 78.5 ± 7.3 | <0.001 |
| bPP (mmHg) | 53.6 ± 8.3 | 46.7 ± 7.1 | <0.001 |
| HR (ppm) | 61.6 ± 9.1 | 71.4 ± 10.6 | <0.001 |
| RAIx (%) | 43.0 ± 12.2 | 42.8 ± 13.8 | 0.512 |
| CSBP (mmHg) | 91.0 ± 8.9 | 96.7 ± 9.0 | 0.020 |
| PA (mmHg) | 30.2 ± 7.3 | 26.6 ± 7.6 | 0.046 |
| PWV (m/s) | 7.0 ± 1.0 | 7.5 ± 0.8 | <0.001 |
| DA (%) | 25.7 ± 6.4 | 18.4 ± 4.7 | <0.001 |
| Tr (ms) | 60.6 ± 6.4 | 64.1 ± 8.1 | 0.539 |
| SS (mmHg/ms) | 0.70 ± 0.15 | 0.59 ± 0.13 | <0.001 |
Values, (Mean ± SD);
SS, bPP, Brachial pulse pressure (bSBP – bDBP); Ascending systolic pressure slope (bPP/Tr).
General characteristics
Among the conventional indicators derived from the radial pulse wave analysis, the athletes presented similar RAIx (p = 0.512), lower CSBP (p = 0.020), lower significantly PWV (p < 0.001), and higher PA (p = 0.046).
Beyond conventional indicators athletes showed significantly steeper SS (p < 0.001), with a similar rise time Tr (p = 0.539) and greater DA than controls (p < 0.001).
Age and bDBP correlated significantly but inversely with SS and DA (Table 2). SS and DA correlated with each other (R = 0.269, p = 0.025). Further, DA also correlated significantly with PP (R = 0.271, p = 0.021) but not with HR (R = 0.054, p = 0.654). SS correlated significantly with PP (R = 0.832, p < 0.001), but not with HR (R = −0.056, p = 0.641), indicating that athletes have a steeper and wider pressure wave than controls. The negative correlation between DBP and SS could indicate that a lower peripheral resistance contributes to a faster left ventricular ejection and a higher peripheral arterial compliance.
| SS | DA | |
|---|---|---|
| Age | −0.332** | −0.271* |
| Height | −0.170 | 0.092 |
| bDBP | −0.333** | −0.320** |
| PWV | 0.059 | −0.054 |
| HR | −0.056 | −0.054 |
Significant level 0.05;
Significant level 0.01 (Bilateral).
Bivariate correlations coefficients
In multiple regression analyses (Table 3), high performance training, age, body height and HR were identified as independent predictors of DA, whereas high performance training and age were identified as independent predictors of SS. bDBP was excluded as independent predictor of either SS or DA.
| Parameter | Systolic slope | Diastolic amplitude | ||||||
|---|---|---|---|---|---|---|---|---|
| b | IC 95% | p-value | b | IC 95% | p-value | |||
| Intercept | 0.95 | 0.158 | 1.73 | 0.019 | −17.8 | −48.40 | −12.70 | 0.251 |
| Age | −0.10 | −0.018 | −0.002 | 0.021 | −0.37 | −0.70 | −0.05 | 0.020 |
| Athlete | 1.49 | 0.060 | 0.236 | 0.001 | 9.9 | 6.50 | 13.30 | <0.001 |
| Height | −0.22 | −0.660 | 0.220 | 0.310 | 18.8 | 2.60 | 35.00 | 0.023 |
| HR | 0.00 | −0.002 | 0.005 | 0.410 | 0.15 | 0.02 | 0.28 | 0.027 |
| bDBP | 0.00 | −0.004 | 0.005 | 0.960 | 0.03 | −0.14 | 0.20 | 0.700 |
| PWV | 0.04 | −0.003 | 0.078 | 0.070 | 0.23 | −1.38 | 1.80 | 0.800 |
| R square | 0.32 | 0.50 | ||||||
Athlete, Athlete condition.
Multiple regression analysis
Figure 2 illustrates representative radial pressure recordings of an elite athlete and a control subject. Both had comparable bSBP, whereas the athletes had higher DA, higher bPP, lower bDBP and a more prolonged cardiac period (T) than control subjects. It is noteworthy that the reflected wave had a very low amplitude in both cases. In the athlete the reflected wave was located in the notch on the descending limb of the aortic pressure curve, and in the control subject at the end of the systole, evidenced by a change in the descent slope.
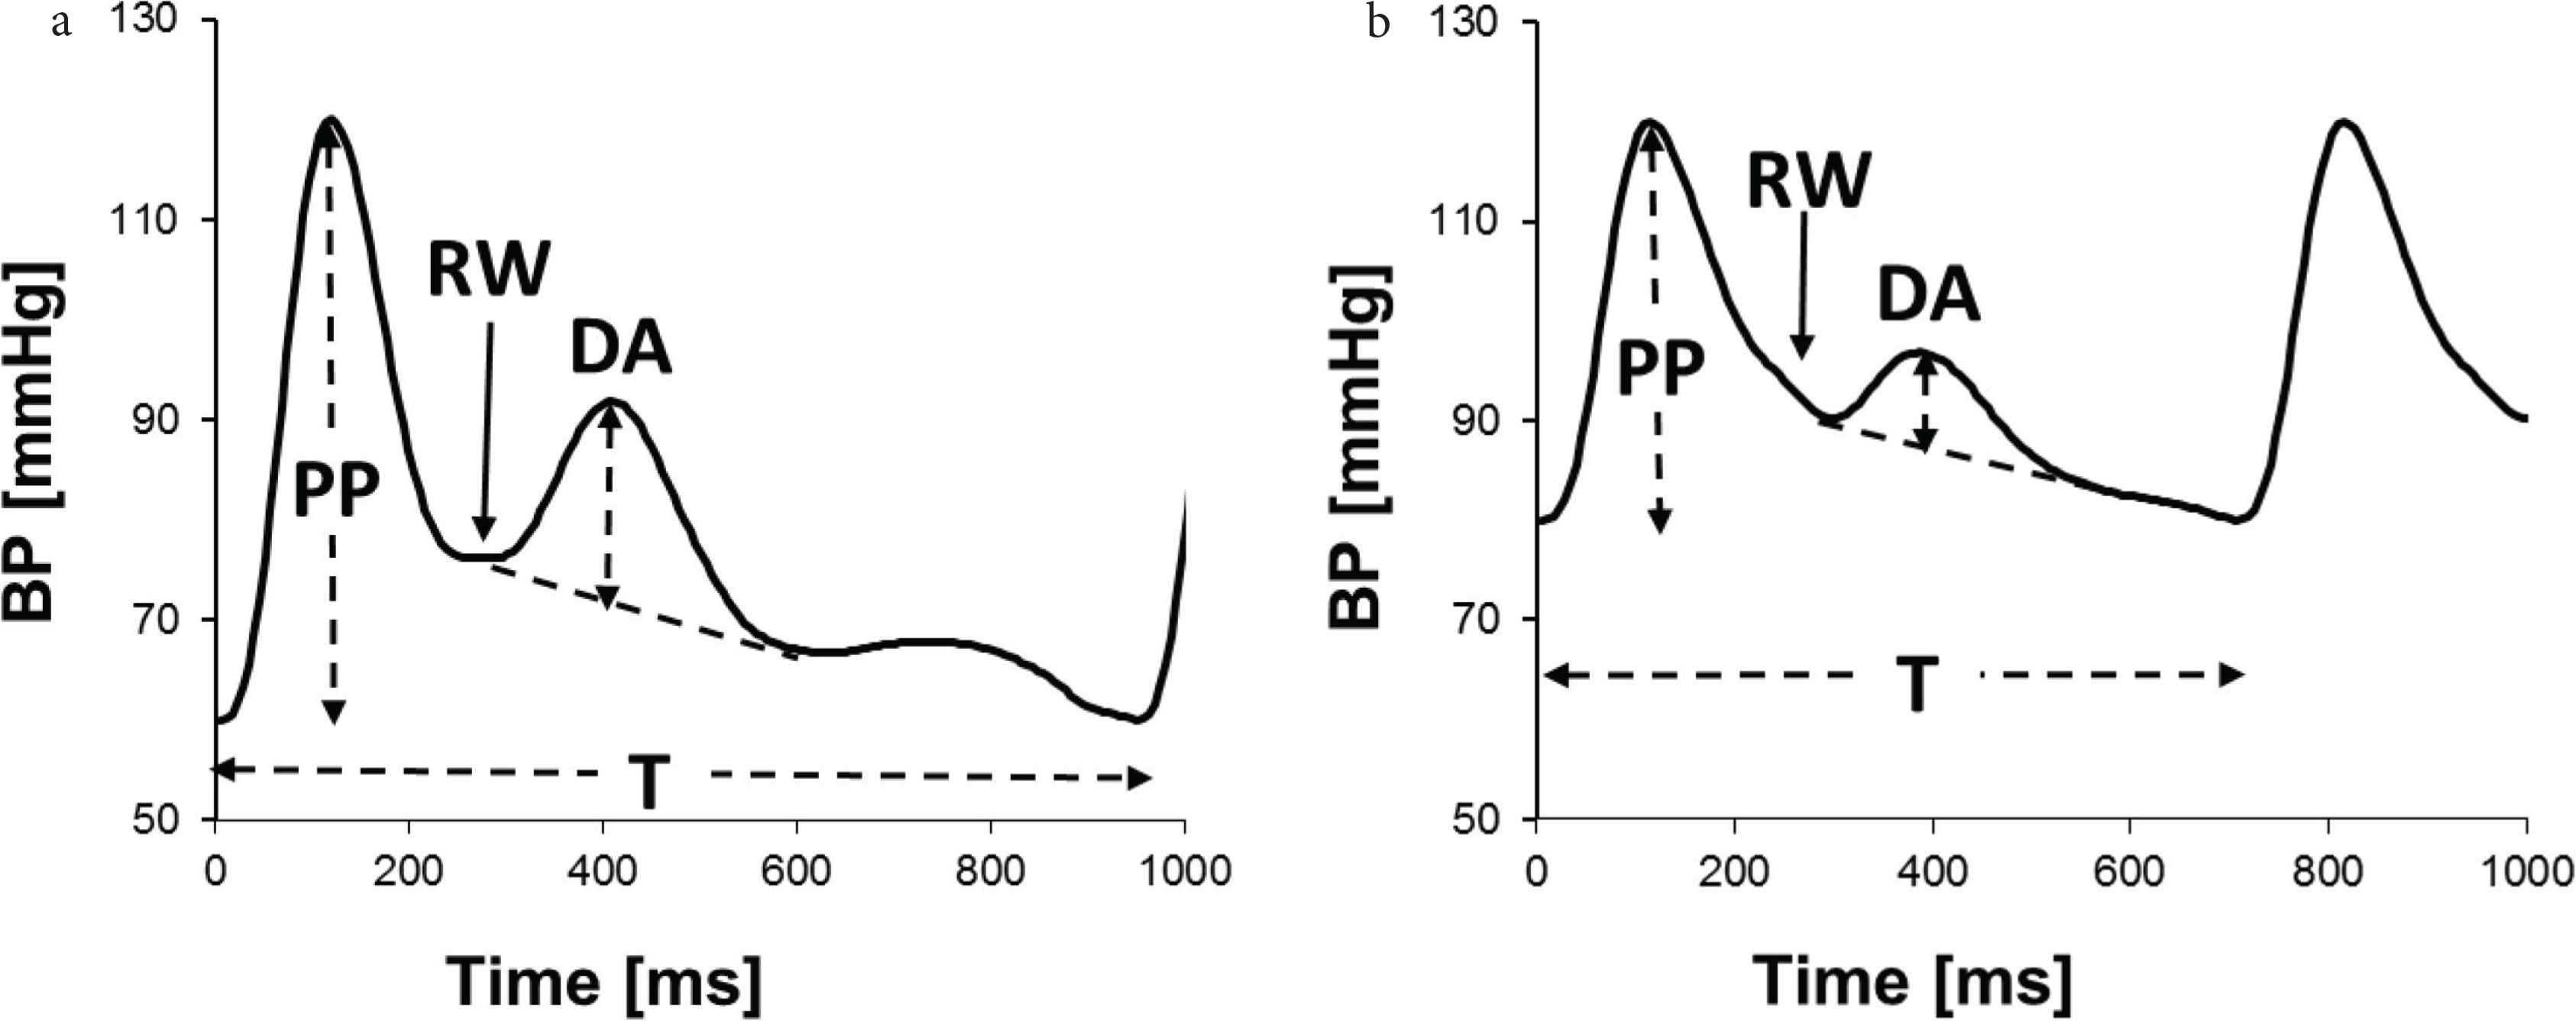
Differences in the amplitude of the systolic and diastolic waves at the radial artery corresponding to an elite athlete (a) and a control subject (b).
4. DISCUSSION
The general characteristics of the athletes were within the expected values. For similar ages, height and bSBP they presented not significant lower BMI and significantly lower bDBP and HR than the controls. Bradycardia is a distinctive feature of cardiac adaptation to physical training [9].
Athletes had higher bPP, determined by a lower bDBP rather than higher bSBP. As previously shown by us, combining radial artery tonometry and hemodynamic evaluation in young healthy controls, higher bPP correlates with higher stroke volume [10]. The lower bDBP in the athletes is likely due to a lower peripheral resistance and the longer diastolic time associated with bradycardia. Unlike very young hypertensive males (age < 30 years), high brachial PP in our normotensive athletes was at the expense of low bDBP [10].
Athletes exhibited higher braquial PP than controls, which is likely due to a higher stroke volume. The steeper SS in athletes correlated with a shorter time Tr. This situation is illustrated in Figure 2, in which the pressure during systole increases 40 mmHg in the control and 55 mmHg in the athlete.
As discussed above, the steepest slope is likely due to the increased stroke volume in the context of lower aortic impedance.
Among conventional arterial indicators, RAIx was similar in both groups, whereas athletes had significantly lower CSBP and aortic PWV than controls. Previous studies have yielded conflicting reports about RAIx and PWV in athletes.
The PWV measured by pulse wave analysis corresponds to the section between the aortic arch and the reflection zone at the aortic terminals and depends on aortic compliance and body height [6,7].
The RAIx depends on the instant of arrival of the reflected wave set by the PWV, and on the amplitude of the reflected wave. The latter depends on the vasoconstrictor tone in the reflection site.
Young individuals have an efficient vasodilator mechanism that causes a low amplitude reflected wave, which arrives at the recording site almost at the end of diastole due to low PWV. Green et al. [11] suggest that this function would not be further improved in athletes compared to healthy young people, because in both groups vasodilation mediated by the endothelial nitric oxide mechanism would be optimal [11]. Therefore, athletes and controls presented similar RAIx values. As a consequence, athletes presented slightly lower values of CSBP, calculated based on RAIx, bSBP and bDBP [1].
Studies in athletes who practice endurance training compared to healthy controls report lower wave reflection, lower systolic load and lower HR [12]. Regarding the effects on PWV, determined by the compliance of the aortic walls, Maldonado et al. [13] reported low aortic velocity in young endurance athletes. However, Dulai et al. [14] and Rátgéber et al. [15] found no PWV differences between endurance athletes and controls, although they did slightly decrease RAIx, without statistical significance. Albu and Bidian [16] studying various reports considered that the improvement of endurance training on aortic pressure and arterial stiffness would not be conclusive, given that in some studies no differences were observed.
The work of Said-Ouamer et al. [17] would explain the cause of these contradictory reports. They found that the effect of endurance training depends on the intensity of the training. Moderate training decreases PWV versus controls, but intense training increases PWV. The apparent contradictions would be due not only to the type of sport practiced, but also to the type of training and its intensity, the latter depending on the criteria of each coach. In our case, the low PWV was due to the predominance of swimmers in the studied group, who train in moderate aerobic form.
The origin of the diastolic wave is explained by the circulatory model called third-order Windkessel, which describes aortic hemodynamics during diastole [18,19]. This model includes the compliance of the distal muscular arteries, the central or aortic compliance, the inertia of the aortic fluid column and the peripheral resistance. Together they form an oscillating system, which in response to stroke volume generates during the diastole a train of damped oscillations, superimposed on an exponential drop in aortic pressure.
During systole, the distal arteries expand and accumulate elastic energy. During diastole, this energy is returned to the arterial system, causing a pressure wave that returns to the aortic root and increases its pressure, repeating the cycle. This results in the train of oscillations whose amplitude is rapidly attenuated, which is observed in Figures 1 and 2. The amplitude depends directly on the compliance of the distal arteries, precisely called the oscillatory compliance. This compliance has been studied by McVeigh et al. [20] and Tao et al. [21], finding that it decreases with age due to endothelial dysfunction and the remodeling of the distal walls. The amplitude of the diastolic oscillation is related to the stiffness of the distal arteries, which increases with arterial hypertension [22].
The compliance of an artery depends on its diameter and walls distensibility. Systematic training has been reported to produce an increase in the diameter of distal arteries, but not in the central ones, and a decrease the intima-media thickness [11]. Both effects contribute simultaneously to the increase of distal compliance. Accordingly, the increase in amplitude of the diastolic oscillation that we have observed in athletes would be a consequence of the increase in distal compliance as a result of intense training that increases the diameter and reduces the parietal thickness of the distal arteries.
High performance training was associated with a particular morphology at the radial wave contour, characterized by a steeper SS, a higher DA and lower bDBP, which likely expresses higher stroke volume, greater distal arterial compliance, and lower peripheral resistance respectively.
4.1. Study Limitations
The intensity of physical training of each athlete was not measured. The measurement of oxygen consumption would have allowed to relate pulse wave characteristics and aerobic capacity. Likewise, it would have been useful to correlate the sphygmographic findings with measurements of the cardiac function by means of echocardiography or impedance cardiography.
We did not evaluate the relative contribution of isometric and isotonic training to the pattern of the radial pressure waveform. Each coach establishes the proportion of isometric and isotonic training according to personal criteria, and the type of sport [23]. Individually, each athlete can incorporate strength training to improve their physical appearance.
As the study only included young male participants, our findings are not applicable to female and/or older athletes.
According to the ACC/AHA 2017 Hypertension Guidelines, nine athletes and 10 controls had their bSBP in the high normal range (120–130 mmHg), whereas three athletes and 10 control had their bSBP in the Stage 1 Hypertension range (130–139 mmHg). However, all of them had their CSBP below 110 mmHg, indicating exaggerated peripheral amplification [24].
As a group, athletes had higher peripheral amplification of SBP than controls. Accordingly, Mahmud et al. [25] also found exaggerated amplification of PP in the context of elastic arteries in young male athletes with abnormally high bSBP, and normal bDBP and CSBP, a condition known as “spurious hypertension”.
5. CONCLUSION
Despite the fact that the sports practiced were diverse, the athletes showed highly SS and DA, suggesting that these are common to all of them, and dependent on the high level of training. The slope of the increase in radial pressure is determined by ventricular ejection velocity and the amplitude of the diastolic oscillation is related to the distal arterial compliance. Both novel markers, in conjunction with peripheral amplification, lower aortic PWV and lower HR, may be indicators of cardiovascular adaptation to high performance training, independently of its type. In this way, pulse wave analysis may provide a simple and accessible way to assess cardiovascular adaptation to physical training.
CONFLICTS OF INTEREST
The authors declare they have no conflicts of interest.
AUTHORS’ CONTRIBUTION
FC, JA and GB contributed in study conceptualization. FC and GM contributed in data processing. FC contributed in writing (original draft) the manuscript. FC, JA and GM contributed in writing (editing) the manuscript. JA, GB, CR and MF contributed in writing (review) the manuscript. JA and GB supervising the project. CR, GM and MF contributed in data acquisition.
Footnotes
REFERENCES
Cite this article
TY  - JOUR
AU  - Fernando Clara
AU  - José Alfie
AU  - Gustavo Blanco
AU  - Cecilia Resina
AU  - Meschino Gustavo
AU  - Mariana Fita
PY  - 2020
DA  - 2020/12/12
TI  - Radial Pulse Wave Analysis in Young Male Elite Athletes
JO  - Artery Research
SP  - 69
EP  - 74
VL  - 27
IS  - 2
SN  - 1876-4401
UR  - https://doi.org/10.2991/artres.k.201208.001
DO  - 10.2991/artres.k.201208.001
ID  - Clara2020
ER  -