
The Human Systemic and Cerebral Circulations: Contrasts in Structure and Function
- DOI
- 10.2991/artres.k.200704.001How to use a DOI?
- Keywords
- Wave reflection; reflection coefficient; pressure waves; flow waves; intracranial pressure; pulse wave analysis
- Abstract
Apart from peculiarities of the cerebral circulation, required to perfuse the brain with the subject erect, the principles established for function of the human systemic circulation (pulsatile flow at input and steady flow at output in capillaries) are identical to those established for other mammals. Assumption of the erect posture first as Homo erectus, then as Homo sapiens, conferred huge advantage to humans and led to command of the mammalian kingdom. But this required a circulation which could perfuse the brain securely against gravity in all positions of the body. This review covers what presently is known about the human cerebral circulation, and how such knowledge can be applied in some clinical conditions including development of dementia in older subjects, and in management of patients with elevation of intra-cranial pressure in younger subjects.
- Copyright
- © 2020 Association for Research into Arterial Structure and Physiology. Publishing services by Atlantis Press International B.V.
- Open Access
- This is an open access article distributed under the CC BY-NC 4.0 license (http://creativecommons.org/licenses/by-nc/4.0/).
1. INTRODUCTION
The human systemic circulation and its major component, the cerebral circulation have evolved together to support the upright stance of humans and the advantages that this confers, with the brain on top of the long body, close to sensors for sight, hearing, taste, smell and proprioception. In the process of change from Homo erectus to Homo sapiens, the brain grew further and developed other features that provided advantage in the struggle for survival through dominance and conquest [1]. This required the brain to have a profuse, secure circulation at rest and during activity in different positions of the body, as well as when erect.
Human body sensors are in turn, close to the brain’s major centres for processing information, and to major motor centres which initiate and control motor responses. The human body can respond more quickly to events around it, with more information and purpose than other mammals.
The aim of this review is to compare physical properties of the systemic and cerebral circulations in mammals and in humans so that one can better understand how they function optimally to move blood around the body, powered by the heart’s Left Ventricle (LV) to provide constancy of the body’s internal environment (milieu intérieur) under different circumstances and with greatest efficiency. Relative dimensions of these blood vessels are provided in Table 1.
| Class number | Vessels | Mean diameter (mm) | Number of vessels | Mean length (mm) | Total cross section (cm2) | Total volume (ml) | Total blood volume | |
|---|---|---|---|---|---|---|---|---|
| Systemic | ||||||||
| 1 | Aorta | (19–4.5) | 1 | (2.8–0.2) | 60 |  |
11% | |
| 2 | Arteries | 4.000 | 40 | 150.0 | 5.0 | 75 | ||
| 3 | Arteries | 1.300 | 500 | 45.0 | 6.6 | 30 | ||
| 4 | Arteries | 0.450 | 6,000 | 13.5 | 9.5 | 13 | ||
| 5 | Arteries | 0.150 | 110,000 | 4.0 | 19.4 | 8 | ||
| 6 | Arterioles | 0.050 | 2.8 × 10⁶ | 1.2 | 55.0 | 7 | ||
| 7 | Capillaries | 0.008 | 2.7 × 10⁹ | 0.65 | 1,357.0 | 88 | 5% | |
| 8 | Venules | 0.100 | 1.0 × 10⁷ | 1.6 | 785.4 | 126 |  |
67% |
| 9 | Veins | 0.280 | 660,000 | 4.8 | 406.4 | 196 | ||
| 10 | Veins | 0.700 | 40,000 | 13.5 | 154.0 | 208 | ||
| 11 | Veins | 1.800 | 2,100 | 45.0 | 53.4 | 240 | ||
| 12 | Veins | 4.500 | 110 | 150.0 | 17.5 | 263 | ||
| 13 | Venae cavae | (5–14) | 2 | (0.2–1.5) | 92 | |||
| 1406 | ||||||||
| Pulmonary | ||||||||
| 1 | Main artery | 1.600 | 1 | 28.0 | 2.0 | 6 |  |
3% |
| 2 | Arteries | 4.000 | 20 | 10.0 | 2.5 | 25 | ||
| 3 | Arteries | 1.000 | 1,550 | 14.0 | 12.2 | 17 | ||
| 4 | Arterioles | 0.100 | 1.5 × 10⁶ | 0.7 | 120.0 | 8 | ||
| 5 | Capillaries | 0.008 | 2.7 × 10⁹ | 0.5 | 1,357.0 | 68 | 4% | |
| 6 | Venules | 0.110 | 2.0 × 10⁶ | 0.7 | 190.0 | 13 |  |
5% |
| 7 | Veins | 1.100 | 1,650 | 14.0 | 15.7 | 22 | ||
| 8 | Veins | 4.200 | 25 | 100.0 | 35 | |||
| 9 | Main veins | 8.000 | 4 | 30.0 | 6 | |||
| 200 | ||||||||
| Heart | ||||||||
| Atria | 2 | 30 |  |
5% | ||||
| Ventricles | 2 | 54 | ||||||
| 84 | ||||||||
| 1690 | 100% | |||||||
Model of vascular dimensions of a 20 kg dog. Relative dimensions are similar to humans. [Table from Milnor, 1989]
The systemic circulation is powered by the LV, which ejects blood into the ascending aorta whence it travels throughout the body through major arteries, which cushion its pulsations so that it can be passed in a near-steady stream through the high resistance arterioles into the capillaries where oxygen and nutrients are taken up and catabolites discharged. From peripheral capillaries to venules to the heart’s right atrium, blood passes as a consequence of residual arterial pressure, and pressure from external venous compression and function of venous valves.
The systemic circulation of humans and different mammals follows body shape with wide, high calibre high pressure, low resistance arteries acting like the high voltage distributing network of a city’s electrical power supply, and with fall in mean pressure by just 1–3 mmHg over the length of a metre or more from proximal aorta to 1 mm wide distal distributing arteries (Table 1). Function of the arterial tree includes that of a conduit, but it also has to act as a cushion. Cushioning function is achieved by converting intermittent pulsations from the LV in such a way that the centrifugal wave from the heart passes over the whole arterial tree and is reflected at the junction of low resistance arteries with high resistance arterioles. Such physical properties of the arteries and arterioles are matched to dimensions of the body. A favourable match is achieved in mammals irrespective of size, so that the mean component of the flow wave is carried into the arterioles and capillaries while the pulsatile component which travels in the wall is reflected backward, so that it reverses its direction, and returns to the heart. Such a physical arrangement of bodily dimensions and timing of forward and backward waves results in optimal efficiency both at the beginning of the arterial tree and at its end (Figure 1) [2]. In the multitude of distal arterial/arteriolar junctions, flow in the arterioles and beyond is steady, near-continuous, with minimal frictional energy loss from steady forward flow in arterioles and capillaries. Reflections from the multitude of sites join to generate a secondary wave which returns to the LV with such timing as to increase aortic pressure during the relaxation phase of the cardiac cycle, and so aid in coronary and cerebral perfusion (Figure 1). The reflected wave returns to the heart after the initial ascending aortic flow peak, so that LV pressure during systole is minimised, coronary flow during diastole is maximised, and LV function is optimised [3,4]. Further, in the uppermost part of the body, fluctuations in pressure are minimised so that cerebral flow during diastole is forward, with no backflow in diastole [3,4]. Taking the analogy of electric alternating current (AC) again, the pressure wave is “rectified”, and pressure fluctuation is relatively low throughout the whole cardiac cycle in arteries perfusing the brain, under conditions that Cerebral Perfusion Pressure (CPP) is tolerable. For low CPP, caused either by arterial hypotension or intracranial hypertension, zero or negative flow through cerebral arteries can be observed [5].
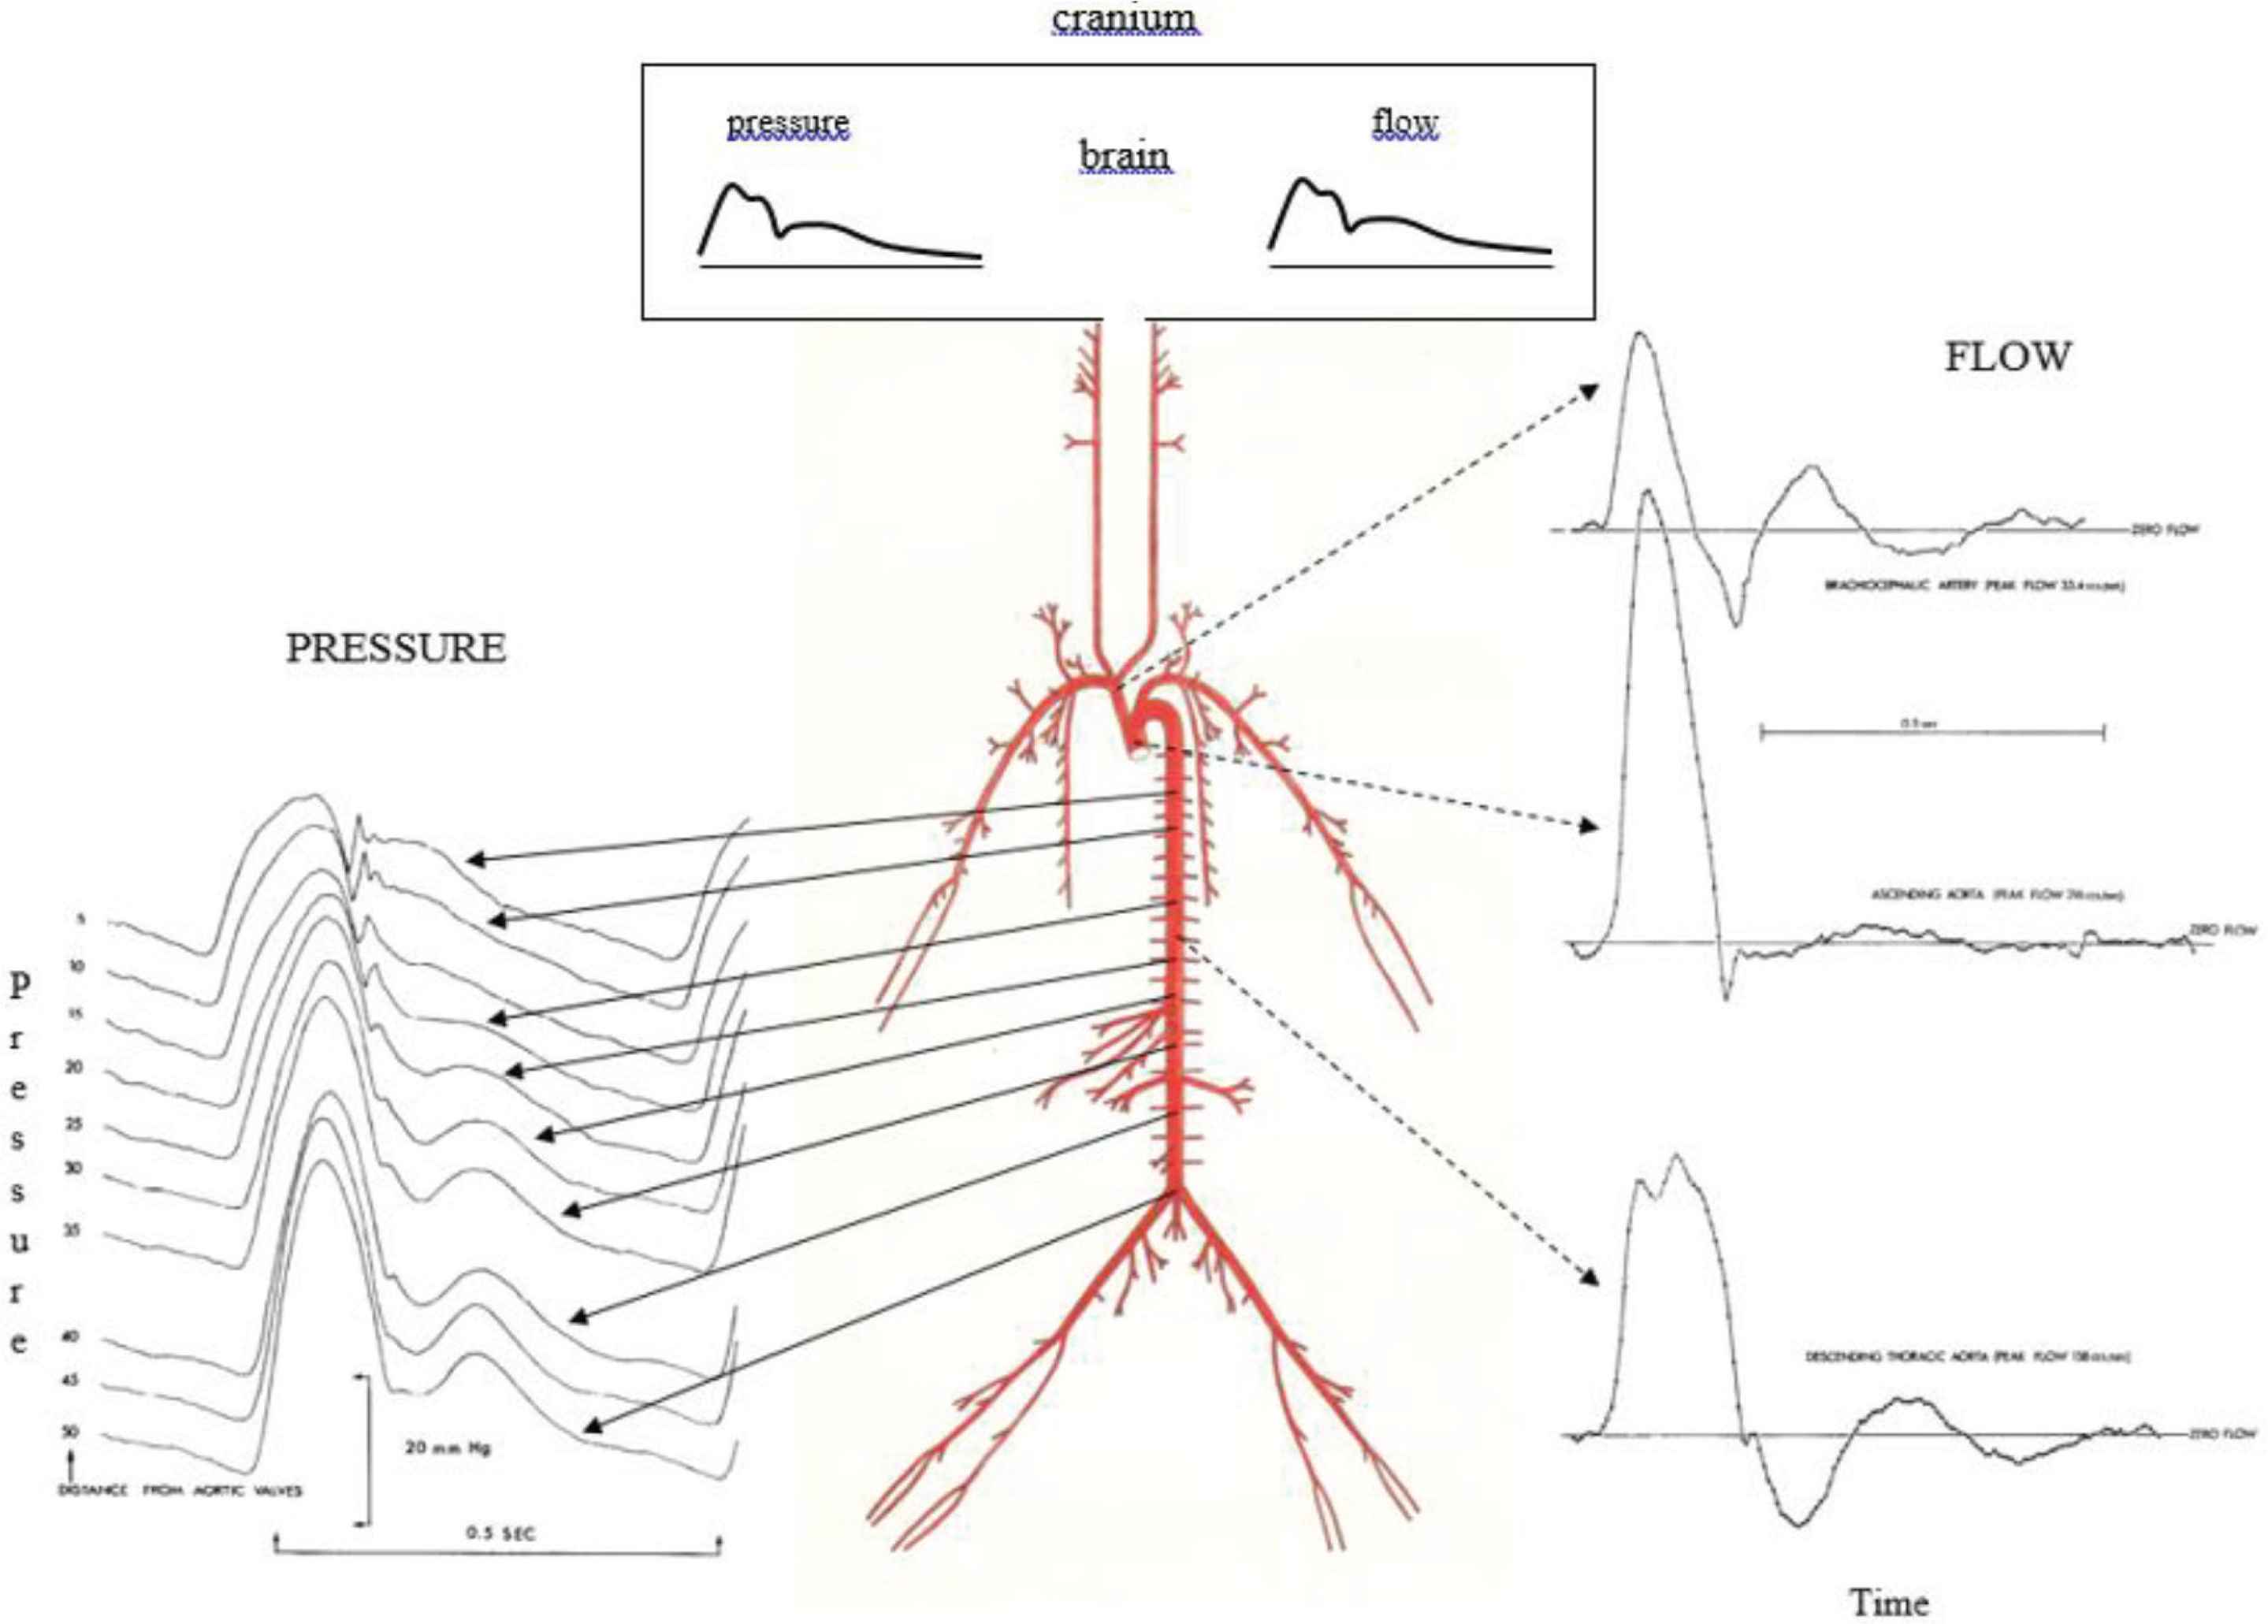
Arterial pressure (left) and flow (right) waveforms in the time domain show clear evidence of wave reflection at corresponding sites in animals and in humans. The cerebral circulation is indicated at the very top at center, with components of pressure waves, flow waves, and mean pressure and flow very similar. From O’Rourke [6] and O’Rourke (J Applied Physiol 1967;23:139–149).
The physical arrangement of bodily anatomy and arterial function is seen throughout the mammalian kingdom. Irrespective of body size the arterial tree is matched to the heart and peripheral resistance. One consequence is the relationships between heart rate and body dimensions, for maximal cardiovascular efficiency [6]. Heart rate is inversely related to body length (and the third power of body mass) throughout the mammalian kingdom [2].
The human systemic arterial tree conforms with these principles, when one considers human adults of working age. But humans live to an older age than most other mammals and their arteries show much more evidence of degenerative stiffening with age than other mammals [2]. Such stiffening in humans causes increased pressure Pulse Wave Velocity (PWV) along the aorta so that reflected waves return from the periphery of the body much earlier in the cardiac cycle. Thereby in older humans, pressure during cardiac systole is increased and pulse pressure (systolic minus diastolic pressure) increases [3,4]. Cardiac inefficiency results, and explains many of the cardiovascular problems that develop with increasing age in humans [3,7]. Increased pressure amplitude in cerebral arteries are considered responsible for microbleeds [8] and “pulse wave encephalopathy” [9–11] with development of dementia in older humans [8]. This can be attributed to aortic and elastic arterial stiffening, rather than to primary cerebral artery degeneration; as shown later, cerebral vascular impedance does not increase progressively with age [12]. The systemic arterial tree in young human adults is basically similar in function and general operation to that of other mammals. The arterial pressure waveforms are similar too as are the range of normal blood pressure levels. Because of relatively long body length, changes in pressure with change in posture from lying to standing are potentially more marked in humans; the carotid baroreceptors are better developed in humans to ensure that humans can change posture from lying to standing with minimal change in cerebral flood flow [13]. A syphoning effect within the cranium of humans plays the dominant role in this (see below).
In all mammals, including humans, the general systemic circulation is similar, with the LV pressurising the arteries and arterioles; this maintains systemic arterial pressure beat after beat as a consequence of large artery distensibility and vasoconstrictor tone in arterioles. The arrangement of systemic arteries and other blood vessels (Table 1) enables blood flow to all organs to be adjusted to individual requirements by variation of resting arteriolar tone in these organs, supplemented by hormonal and metabolic factors.
Blood flow to the human brain is different. Major differences are summarised in Table 2 with patterns of pressure and flow waves illustrated in Figure 2.
| Anatomical | Functional |
|---|---|
| Brain entirely within rigid cranium | Cerebrospinal fluid (CSF) creates a syphon within the cranium/spinal canal, maintains constant intracranial cerebral blood flow with different positions of the body, including erect posture and when sitting |
| Brain in continuity with spinal cord in rigid spinal canal | Monro–Kellie principle dependent on the syphon of CSF within the cranium and spinal canal |
| Brain and spinal cord are surrounded by cerebro-spinal fluid within subarachnoid space with cerebral arteries and veins | CSF circulation described by Harvey Cushing as third circulation [after systemic (first) and pulmonary (second)]? Is cerebral circulation the fourth circulation? |
| Cerebral circulation entirely within cranium/spinal canal of humans, no anastomosis with extracranial circulation | |
| Internal carotid artery enters skull at same level as jugular vein exits skull (level at external auditory meatus but within nasopharynx where pressure is atmospheric) | Little or no vascular tone in cerebral arteries and arterioles of humans |
| Internal carotid artery passes through carotid canal from outside to inside skull; jugular vein is attached to jugular foramen edge; jugular veins and cerebral veins have no anatomical valves | Entry of blood into brain and cranium is pulsatile. Exit of blood is likewise pulsatile. Therefore, blood flow through capillaries and veins remains pulsatile |
| Other mammals do not have brain entirely enclosed within rigid cranium, nor the separation of intra- and extra-cranial arteries and veins. The human brain and its circulation are unique |
From Kety S. In: Circulation of the blood: men and ideas. Bethesda: American Physiological Society; 1982 [18].
Key features of cerebral circulation in humans compared to other mammals
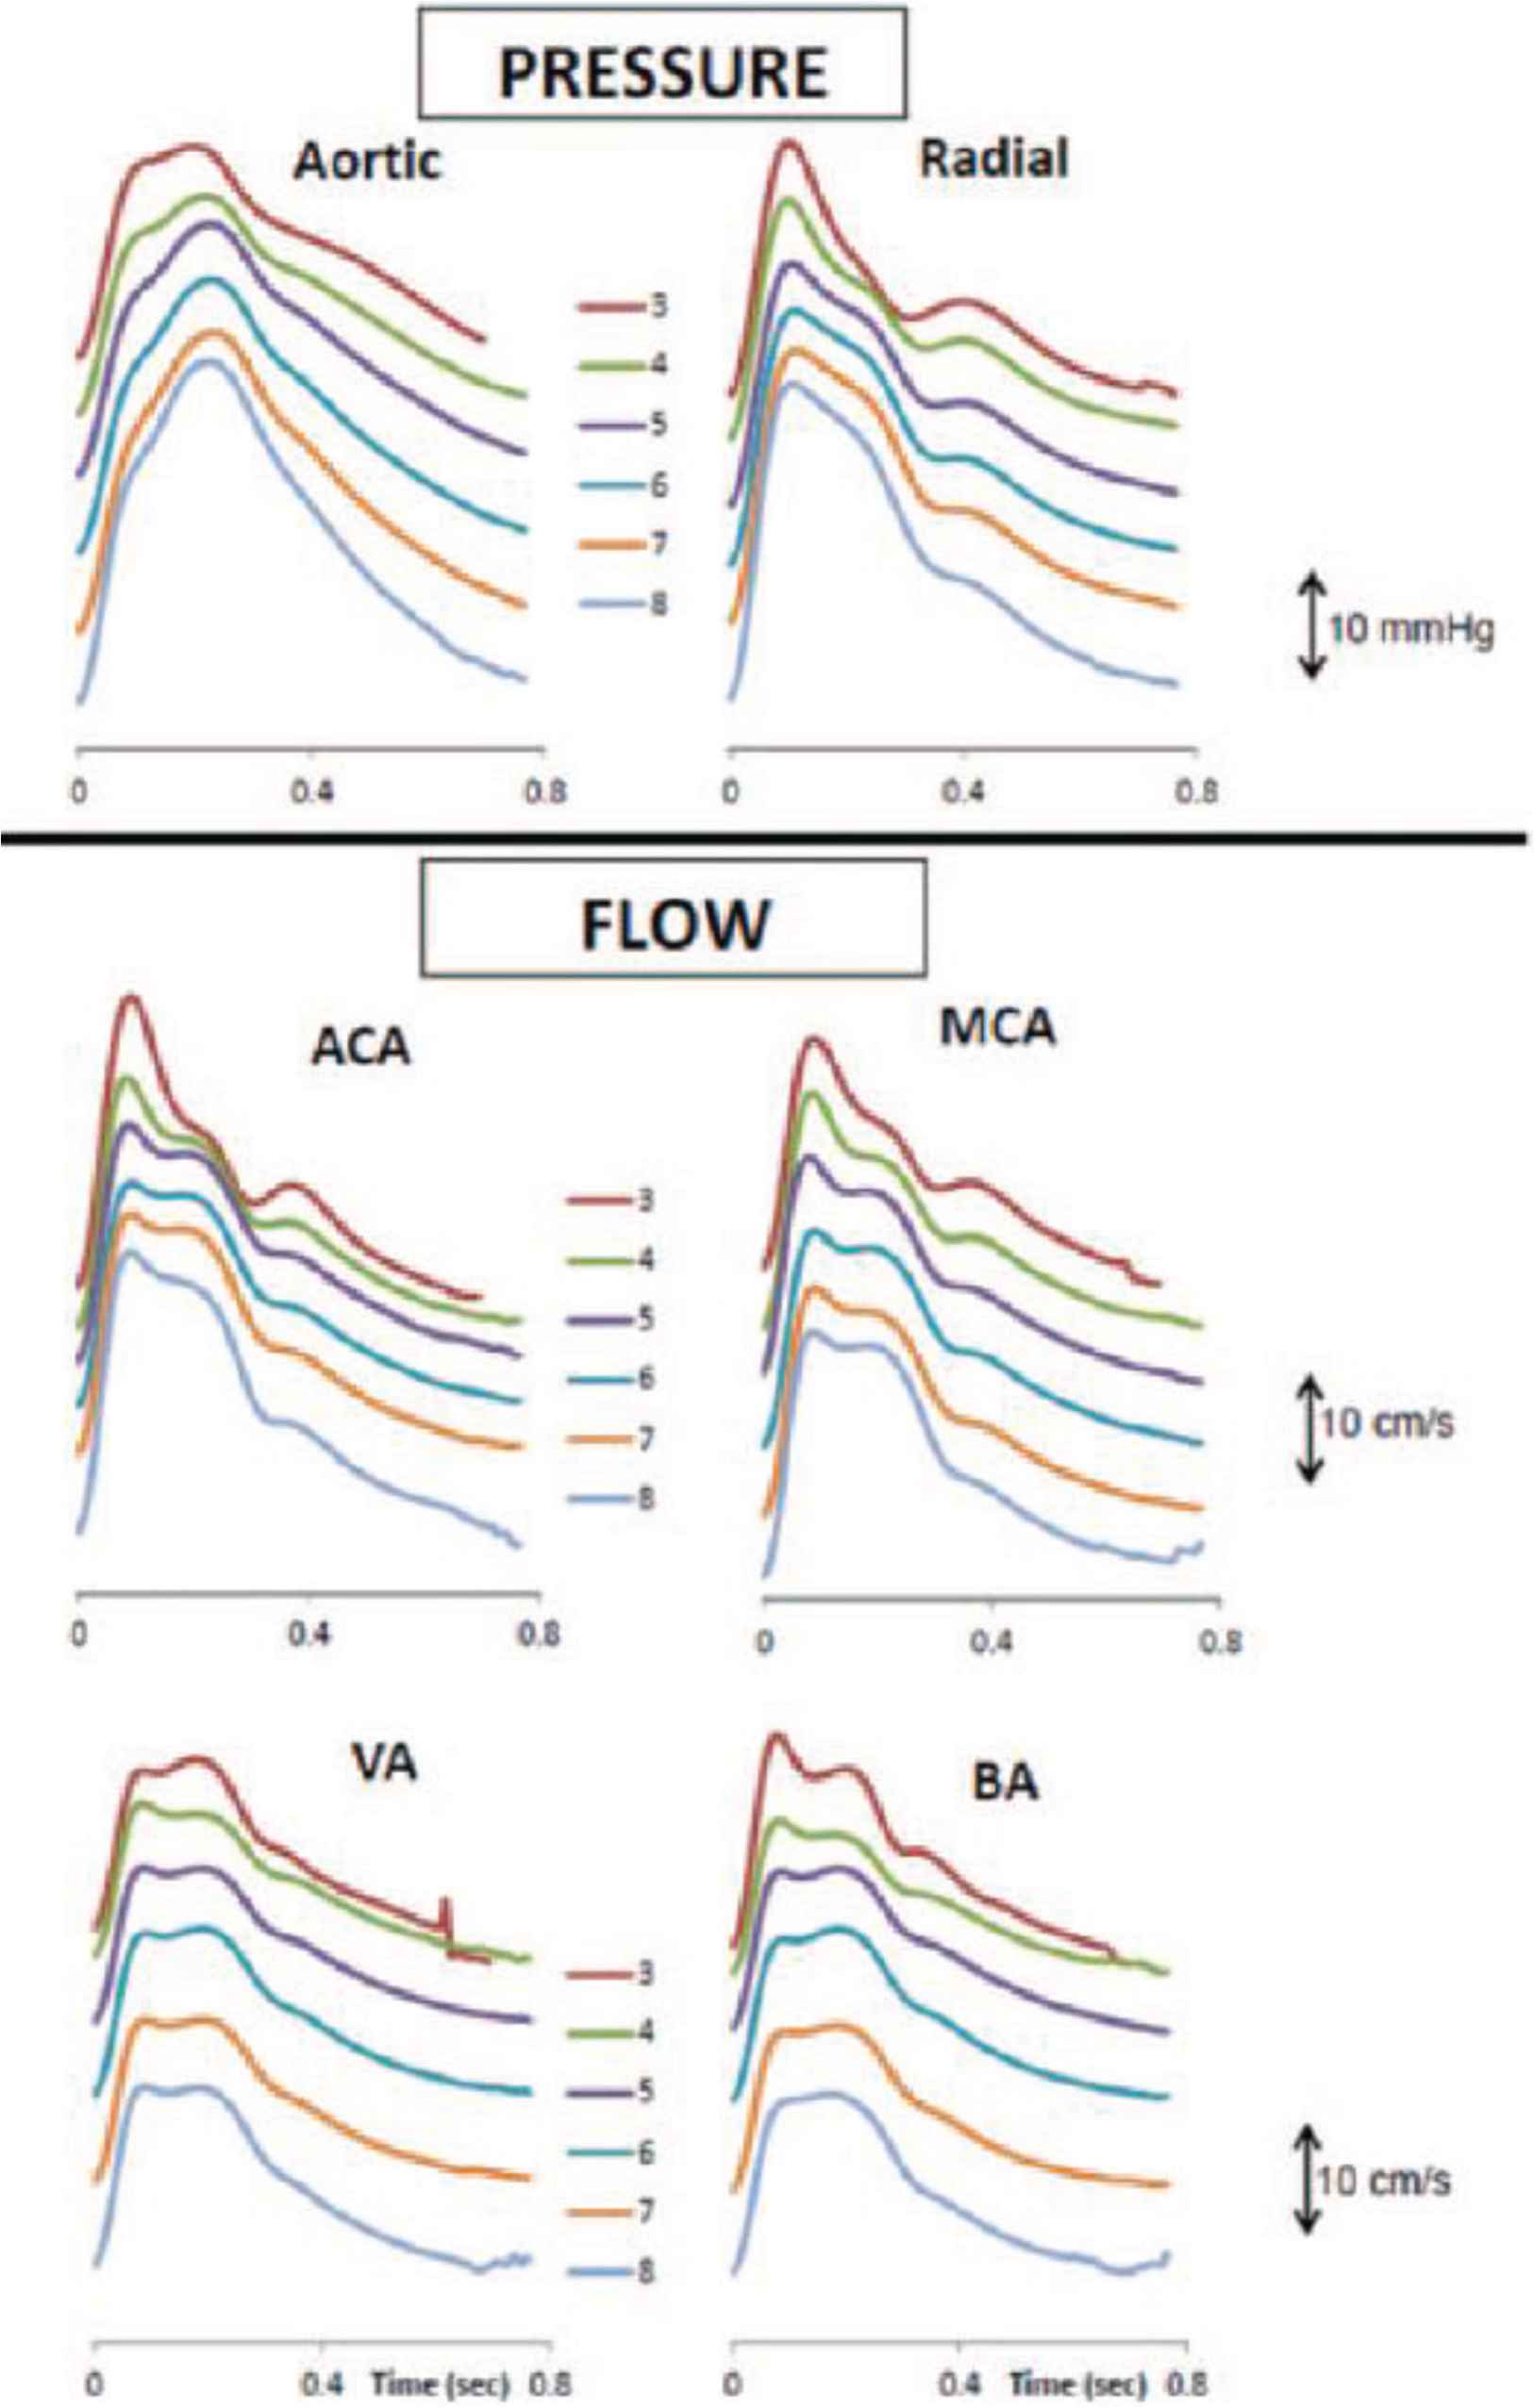
Synthesised-ensemble-averaged pressure waves in the central aorta and measured pressure waves in the radial artery by age decade (top), together with flow waves in the anterior cerebral artery (ACA), middle cerebral artery (MCA), vertebral artery (VA) and basilar artery (BA), for the whole cohort of 1020 normal subjects. From Kim et al. [12].
2. KEY FEATURES OF CEREBRAL CIRCULATION IN HUMANS COMPARED TO OTHER MAMMALS
The common carotid arteries arise from the aortic arch (left side) or the brachiocephalic artery (right side), then after supplying tissues in the neck, divide into external and internal carotid arteries high in the neck, deep to the angle of the mandible. The external carotid supplies other tissues in the face and mouth, while the internal carotid arteries enter the cranium through the carotid canals in the temporal bones on each side. After giving off the ophthalmic artery, the internal carotid artery within the cranium divides into the anterior and middle cerebral arteries to supply the largest part of the brain on each side. The vertebral arteries on both sides arise from the subclavian arteries in the neck, enter the canals of the cerebral vertebral process then pierce the dura matter and enter the subarachnoid space and pass through the foramen magnum into the cranium. The two vertebral arteries then join to form the basilar artery which runs up the brain stem and divides at the Circle of Willis to form the left and right posterior cerebral arteries.
Blood flow patterns are similar in the internal carotid and cerebral (anterior and middle cerebral, and vertebral and basilar) arteries as determined by Doppler transcranial flow or Doppler flow for internal carotid arteries in the neck [12]. For the arteries which exclusively supply the brain in the cranium, there is no backflow during diastole and the flow velocities are relatively low (60 cm/s, mean circa 40 cm/s) but volume flow is high, since diameter of the arteries is relatively wide and amplitude of the pulse (relative to mean flow velocity) is greater in comparison to pulsatility of systemic arterial pressure (pulsatility is distinct but low in all cerebral arteries).
In contrast to blood vessels elsewhere in the body (with the exception of lungs and kidneys), flow remains pulsatile throughout the cerebral arterial tree, and into the small arteries and capillaries where pulsations persist through into the venules, venous sinuses and veins, even into the jugular veins (Figure 3) when blood flows through the jugular foramen on each side into the neck and then into the superior vena cava and right atrium.
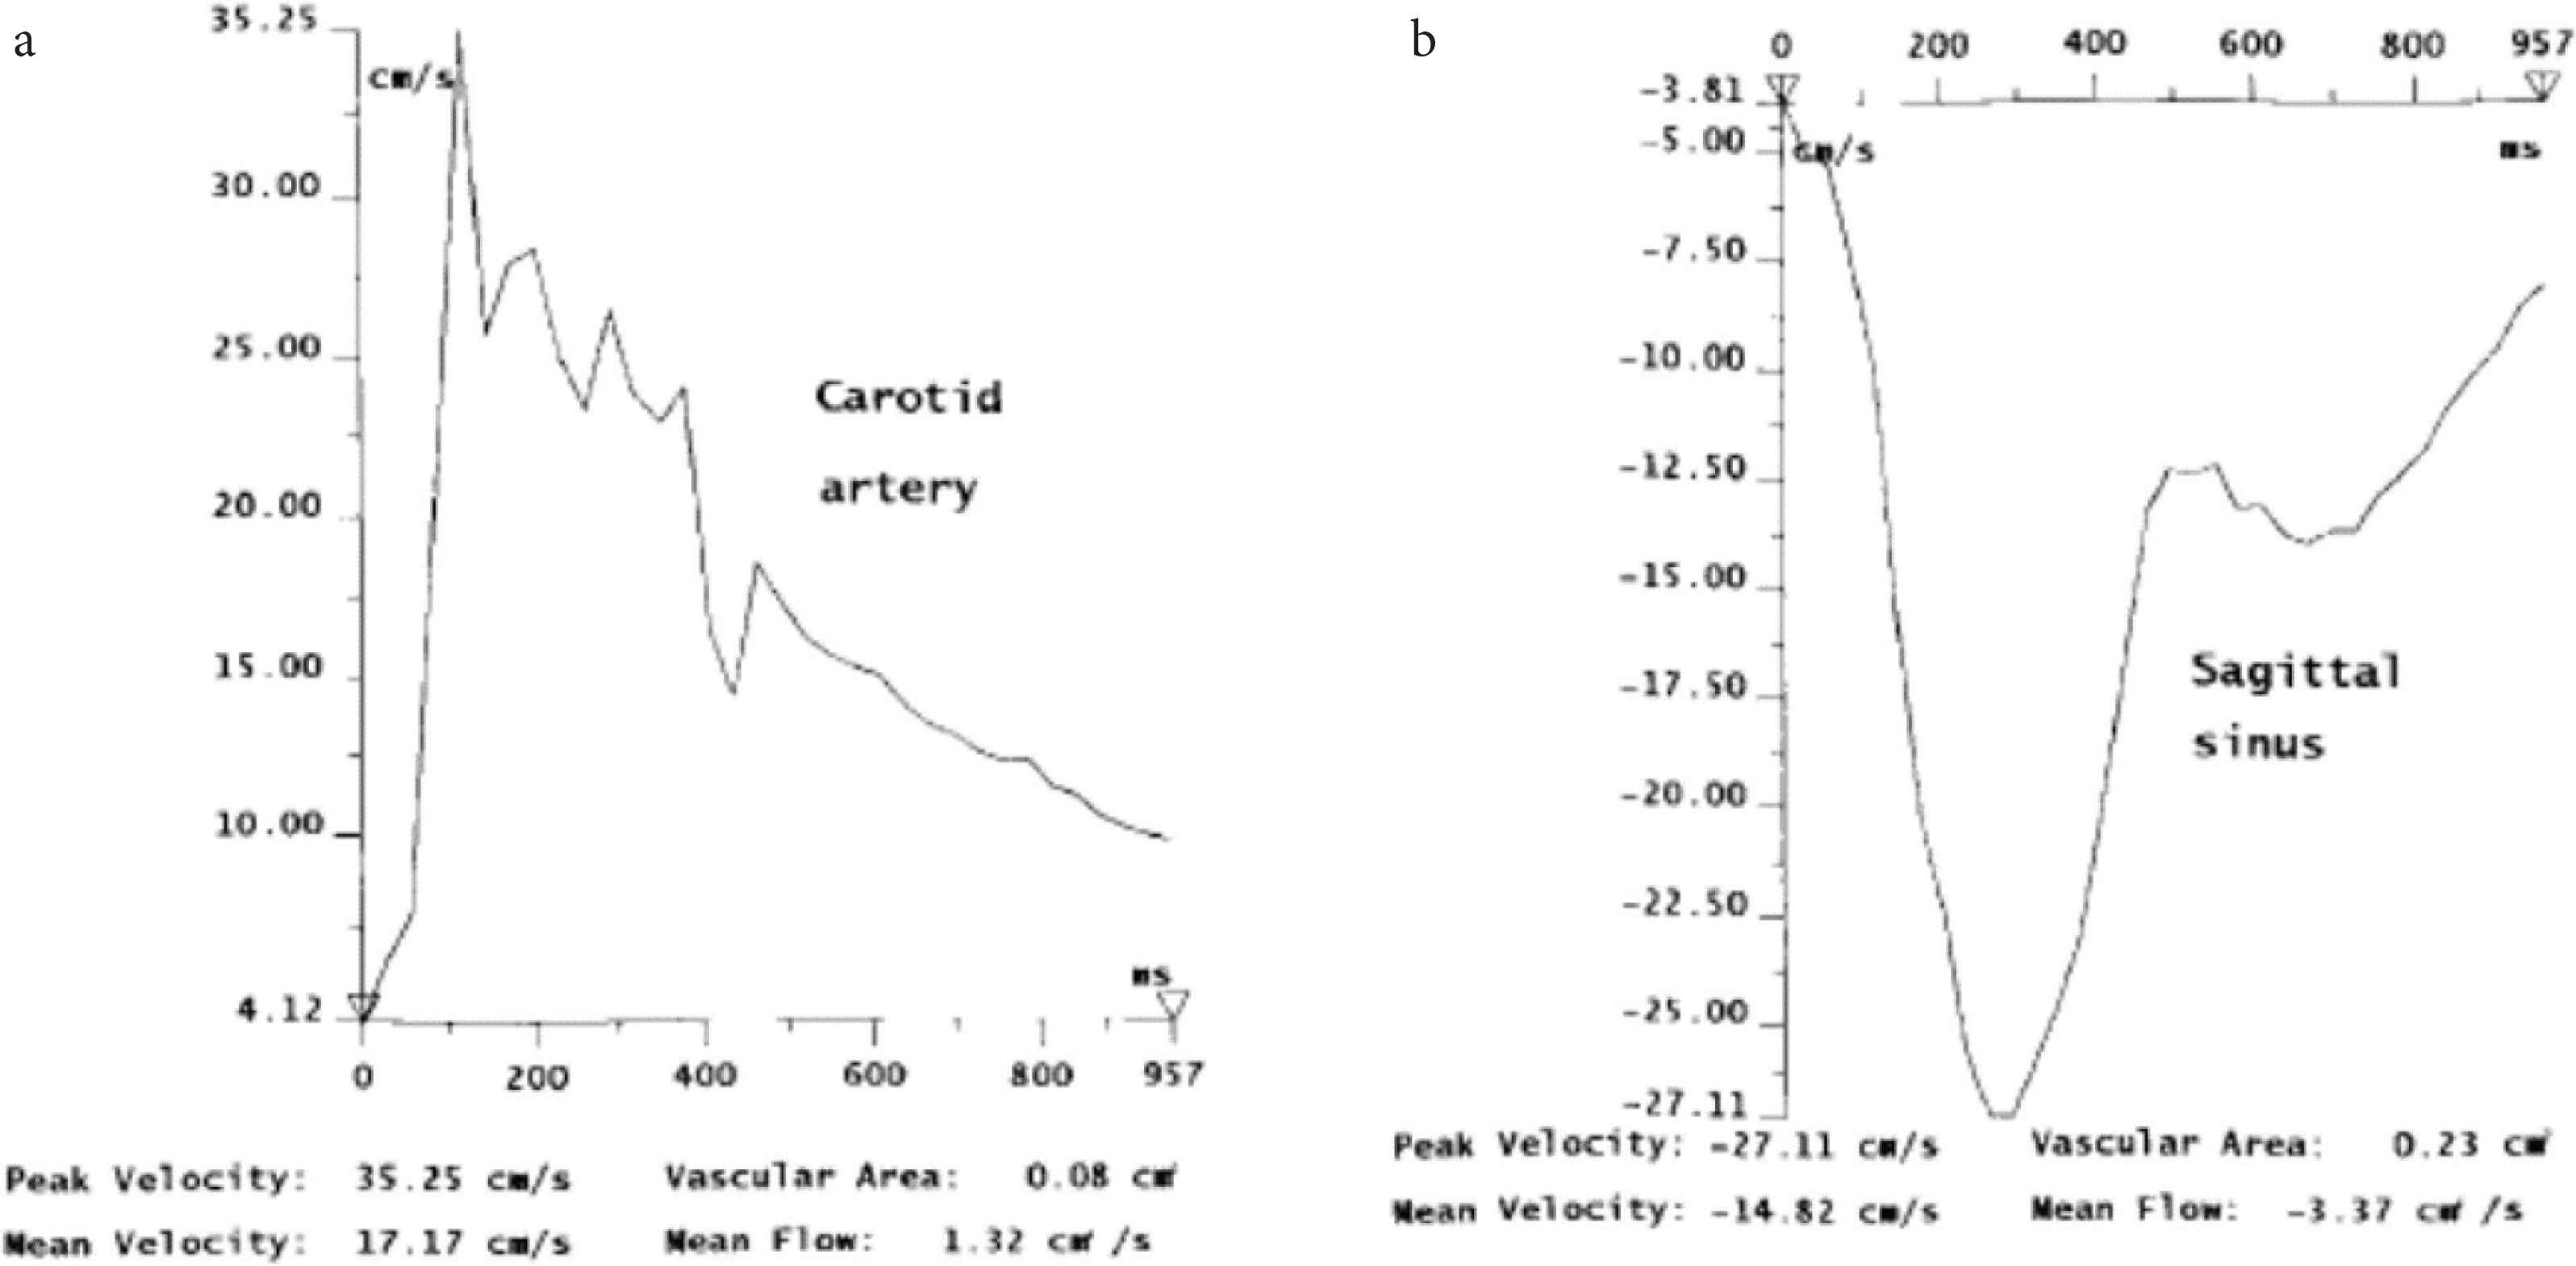
Magnetic resonance imaging flow quantification graphs of a patient with moderate leukoaraiosis. From Bateman [9]. (a) Carotid arterial flow. Note peak flow at circa 100–300 ms after QRS complex (arrow). (b) Superior sagittal sinus flow. Note flow toward the feet is depicted as negative. The peak flow also circa 100–300 ms after QRS complex. Pulsation in artery and vein are substantial, similar in amplitude (velocity), and reciprocal.
Patterns of pressure and flow pulses in cerebral arteries are similar, in contrast to other arteries in the body (except for the lungs and kidneys), and this can be attributed to the high flow, vasodilated bed that the brain presents to the heart. Wave reflection as calculated for cerebral arteries is very low, with typical values of Reflection Coefficient (RC) ~0.4 in contrast to the value of ~0.9 in peripheral systemic arteries such as the femoral. But in such peripheral vascular beds, wave reflection can be reduced to circa 0.2 when the vascular bed is diffusely dilated from reactive hyperemia or infusions of acetyl-choline into the artery of supply (Figure 4) [14]. There is normally no backflow in arteries within the cranium. Backflow is seen often in arteries outside the cranium in the external carotid, subclavian, brachial and femoral arteries, and even in the descending thoracic aorta [15]. Atmospheric pressure for both carotid arteries and jugular veins can reasonably be taken as zero in the soft tissues of the neck where the internal carotid and jugular veins run side by side with the jugular vein held open by bony attachment to the edge of the jugular foramen but flattened to a “ribbon like” tube below when the subject is erect.
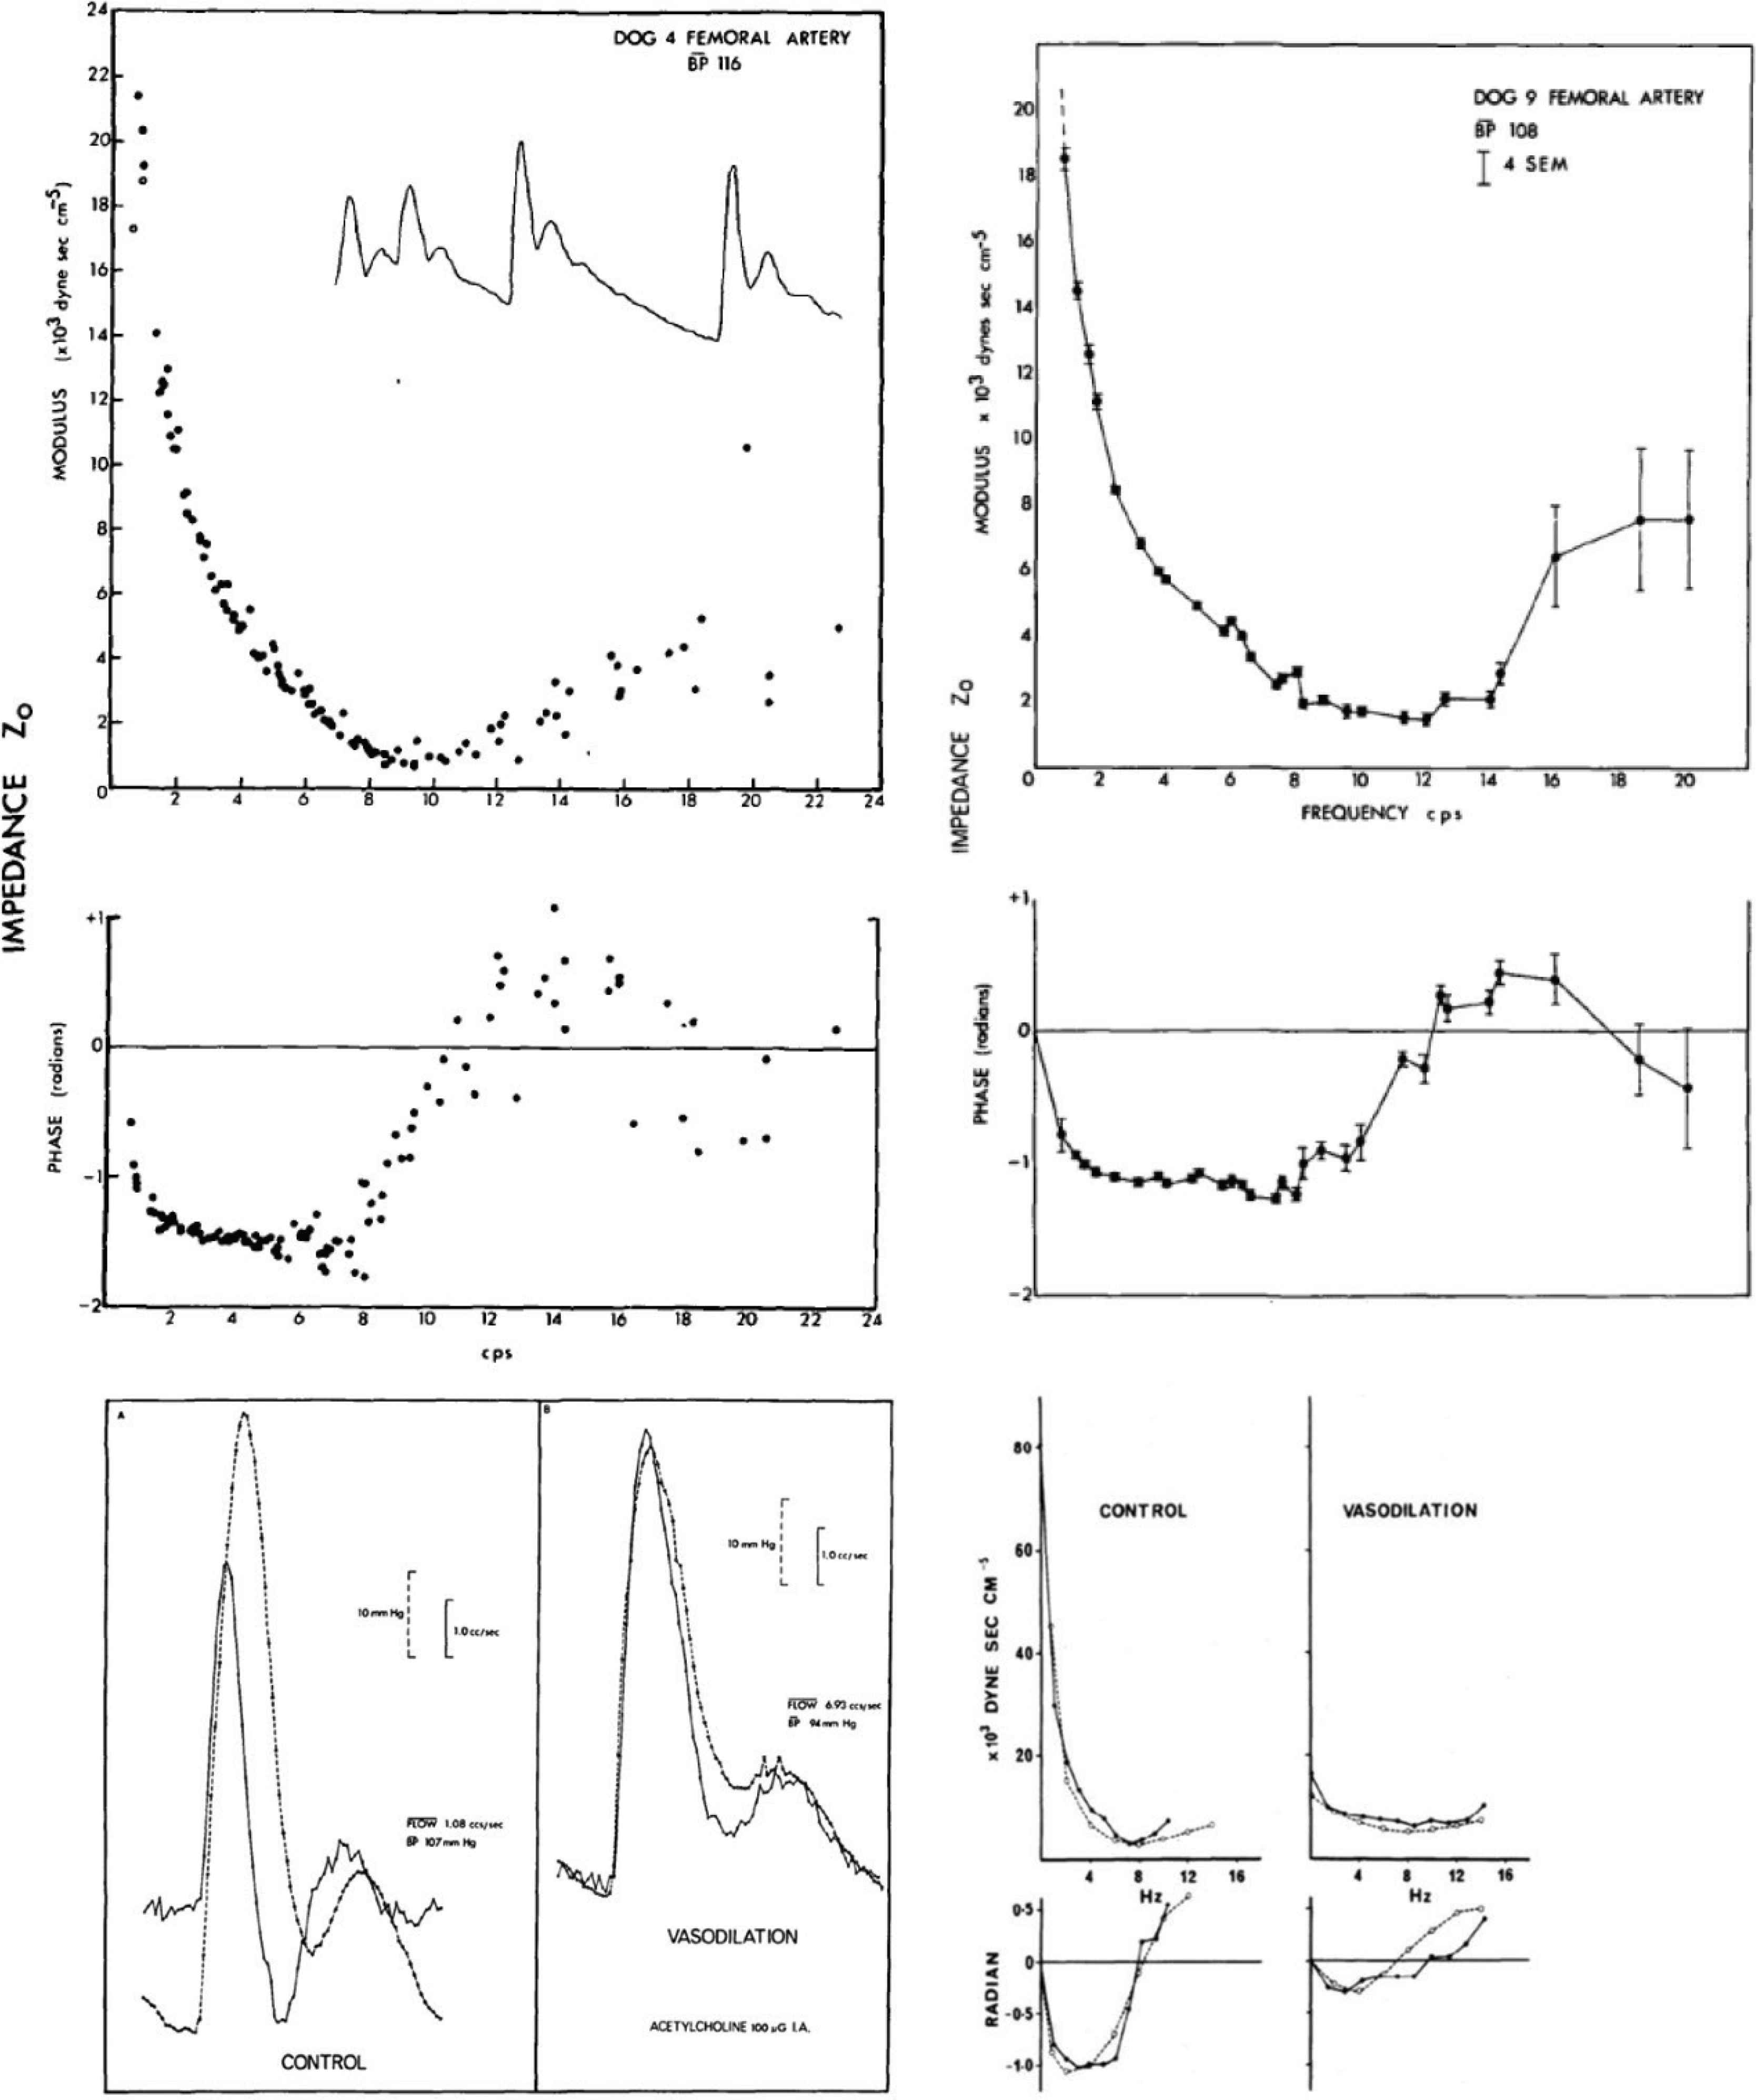
(Top panels) Modulus (above) and phase (below) of femoral vascular impedance determined from a series of pressure and flow waves in two dogs; the first with sinus arrhythmia and irregular heart rate (left), and in dog with surgically induced atrio-ventricular block and heart paced from <1 to 4 Hz (right). Despite gross difference in heart rate period, data points fell along a continuous line. From O’Rourke and Taylor [45]. (Lower left panels) Pressure (dotted line) and flow (solid line) waves in the femoral artery of a dog under control conditions (left) and immediately after infusion of acetylcholine (right) into the femoral artery. Note similarity of flow wave to pressure wave at peak of local drug effect. From O’Rourke [6]. (Lower right panels) Modulus and phase of femoral vascular impedance in a dog at control (left), and immediately after intra-arterial injection of acetylcholine (right). Change in modulus and phase of impedance were explained by modelling studies (dashed line) of a randomly branching vascular bed with Reflection Coefficient (RC) 0.8 for control, zero for acetylcholine. Change in impedance, and in pressure and flow waveforms can be explained on the basis of high resting arteriolar tone in the leg under normal conditions, with near-abolition of arterial tone with acetylcholine. From O’Rourke and Taylor [45].
3. PHYSICAL PRINCIPLES OF CEREBRAL FLOW IN UPRIGHT HUMANS – THE CEREBRAL SYPHON, CEREBRO-SPINAL FLUID, HARVEY CUSHING AND THE MONRO–KELLIE LAW
Along with the lancet, the scalpel and the saw, the craniotomy drill remains one of the surgeon’s enduring instruments and a reminder of the near-miraculous recovery in consciousness that can occur with release of an extra-dural hematoma caused by closed trauma to the cranium. Phenomena related to head injury were studied by anatomists at University of Edinburgh Hospital, in the course of teaching anatomy to medical and surgical students. Included were three generations of the Monro family then George Kellie [16,17], who followed this trio. The era was relatively recent (1750–1850). The subject was on constancy of blood flow to the brain when erect and the key observations were that persons who died by exsanguination, while having no blood of consequence in the systemic arteries or veins, or in the lungs or chambers of the heart, retained blood in cerebral arteries and veins within the cranium; this could be released by drilling a hole in the cranium of the dead human body. Kellie confirmed this phenomenon in animals which had (as in humans) poorly developed collateral vessels between the intracranial and extracranial circulations - the so called “rete mirabile”. He showed the same retention of blood in the cranium after exsanguination in control animals, but no such retention in animals whose cranium had been opened prior to exsanguination [18]. In these animals, as in humans, blood was released as air entered the cranium. This raised the issue of a partial vacuum in the cranium, and of a syphoning system which was active during life and only demonstrable after death. Notable neurosurgeon pioneer Harvey Cushing, around the end of 19th century, took this subject further at Johns Hopkins, Harvard, and Yale Hospitals in the early 20th century, particularly with his studies of raised Intra-cranial Pressure (ICP) and syphoning of blood during life to help maintain steady cerebral blood flow with change in posture [19]. Cushing stressed the importance of Cerebro-Spinal Fluid (CSF) in the subarachnoid space which contained the arteries and veins [20]. Throughout the different levels of the brain and spinal cord, the hydrostatic arteriovenous perfusion pressure remained unchanged, and blood flow could be maintained irrespective of posture. Cushing stressed dynamics of the CSF and its circulation from formation in the choroid plexus of the lateral cerebral ventricles and its absorption in the arachnoid villi of the cephalic circulation on the surface of the cerebral hemispheres (Figure 5).
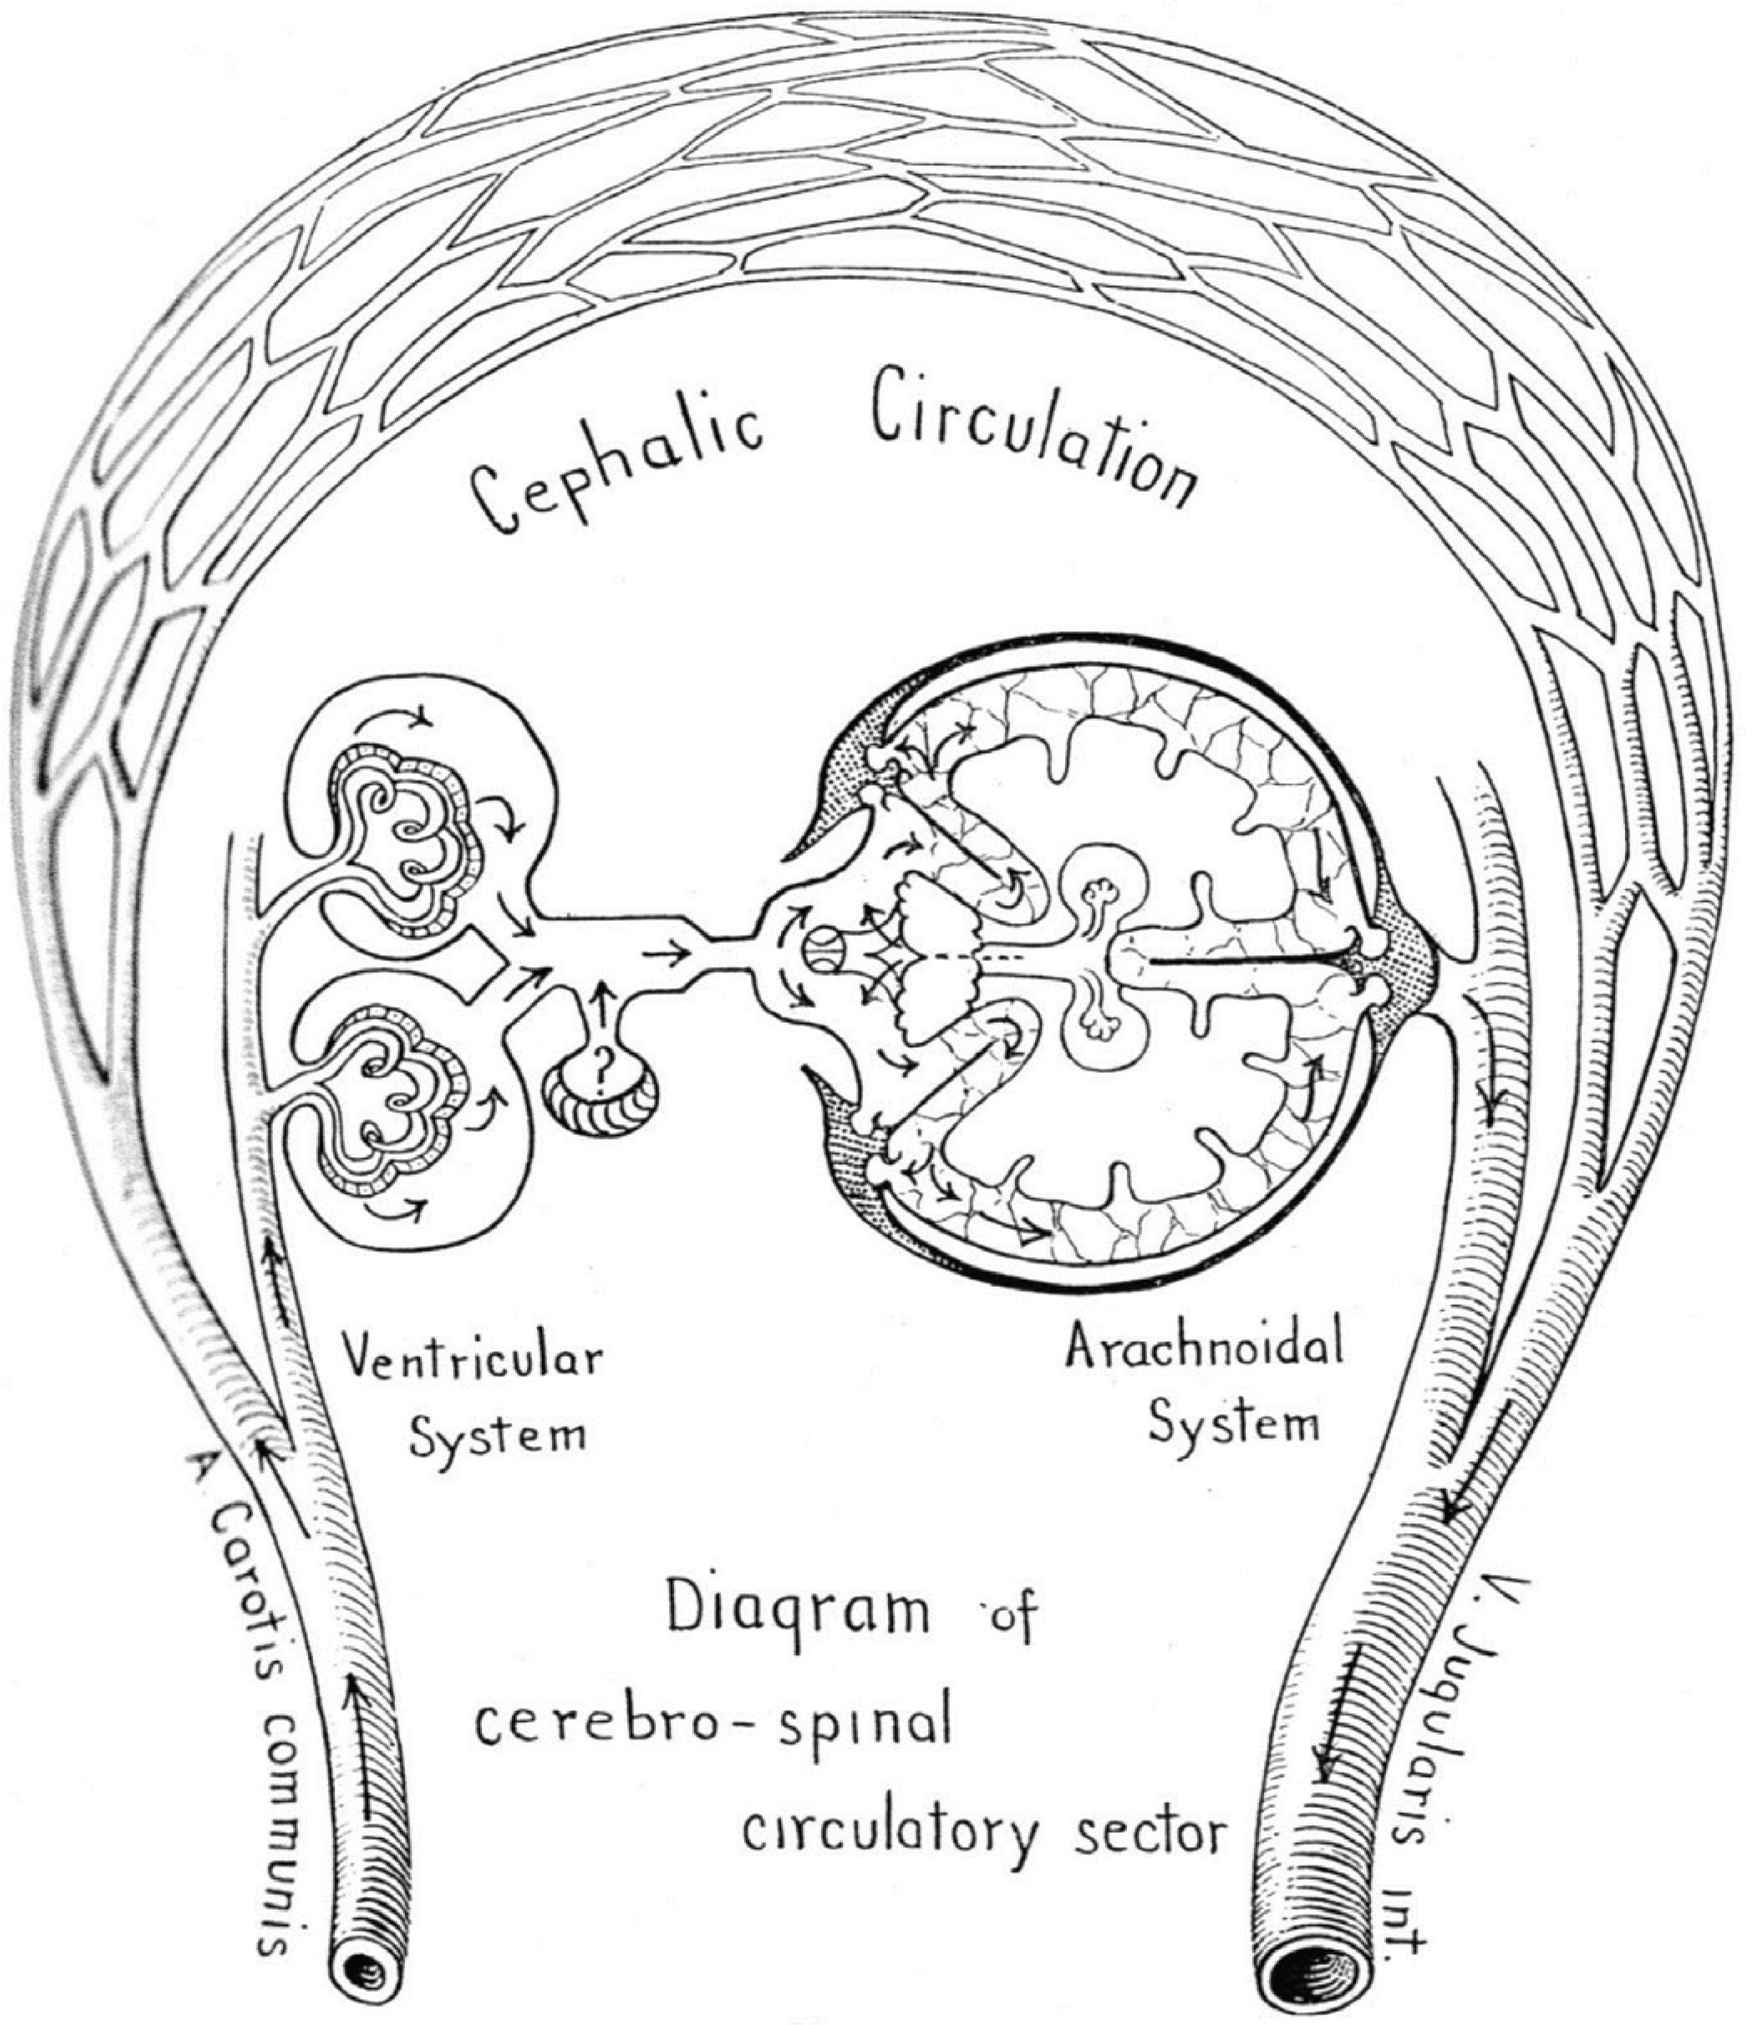
The first, second and third circulation, with CSF as the fourth circulation? From Cushing [19].
The theory of the syphon was based on arteries and veins to the brain passing through the subarachnoid space which was closed in the cranium but subject to atmospheric pressure, so that at any level within the brain, arterial pressure changed to the same amount as did venous pressure in relation to the common zero at the base of the brain; here carotid arteries and jugular veins run side by side and are exposed to atmospheric pressure, in the nasopharynx close to the opening of the Eustachian tube, whose role is to maintain atmospheric pressure to the middle ear.
Cushing noted the opportunity for syphoning to occur when one closed system (“the CSF circulation”) was contained within another closed system (the cranium) to sense gravitational pressure and to correct for this and maintain continuous blood flow with change in posture. A disturbance in this syphoning mechanism may be the cause of visual and cerebral problems in persons exposed to long periods of zero gravity [21–23].
4. AGING CHANGE IN HUMAN ADULTS
4.1. Systemic Circulation
Changes with age in the systemic circulation have usually been directed in the past to brachial artery cuff pressure i.e. to the top and bottom of the pulse in that artery. The original Framingham study has shown very clearly that the major changes from young to old age (25–80 years) are due to aortic stiffening and entail progressive increase in systolic pressure, and with diastolic pressure remaining relatively constant during early adulthood, then decreasing over age 60. Pulse pressure (systolic minus diastolic pressure) in brachial and central arteries increases progressively throughout life [24–26].
More recent studies have confirmed increase in arterial stiffness with age, with such stiffening confined almost exclusively to the thoracic aorta and the large elastic arteries, and are attributed to fatigue and fracture of elastin fibres in the arterial wall [2,3,25]. Changes with age are greater than suggested from earlier studies of brachial pressure, where measures of aortic PWV and aortic characteristic impedance show two to threefold increases over a normal human life span, and with input impedance of the ascending aorta increasing up to fivefold in consequence of early return of wave reflection from peripheral sites, predominantly in the lower body. Such early wave reflection also distorts and “detunes” the favourable relationship between LV ejection and return of wave reflection, such that pressure is boosted in late systole and relatively reduced in diastole, thus compromising cerebral and coronary artery flow in older, otherwise normal humans, particularly women [26,27].
The most recent non-invasive studies of left ventricular/vascular interactions entail generation of ascending aortic pressure [from the radial pressure pulse wave using an US Food and Drug Administration (FDA)-validated Generalised Transfer Function (GTF)] and flow with cardiovascular magnetic resonance. These confirm earlier aging studies obtained invasively on patients undergoing cardiac catheterisation or cardiac surgery [28,29] and can confirm the progressive deterioration of older subjects with respect to LV dysfunction and development of cardiac failure. Cardiac failure and stroke are the most common causes of death in older subjects with aortic stiffening. Increasingly, assessment of aortic pressure and flow waveforms is used to optimise treatment of patients with cardiac failure, or at risk of cardiac failure [30,31].
Increase in aortic stiffness [measured as PWV or vascular impedance (Zc)] directly or in consequence of early wave reflection causes increase in pulse pressure to a much higher degree than either alone and higher still than brachial pulse pressure (since aging reverses the normal amplification of the pressure pulse between the aorta and brachial artery) [34].
4.2. Aging in the Cerebral Circulation
The pressure waves entering the cranium through the carotid canal (internal carotid artery) or foramen magnum (vertebral artery) of older human adults are increased in amplitude and in contour as a consequence of aortic stiffening, discussed above. Direct effects of aging on cerebral arteries can be measured in terms of vascular impedance. This has been studied by our group in conjunction with colleagues [35] at Ruijin Hospital in Shanghai. These show no additional impairment in cerebral vascular impedance with age [12] (Figure 6); however with the magnitude of arterial pressure pulses which enters the cranium unchanged from that in the aorta, as discussed above, amplitude of the cerebral arterial flow wave is correspondingly high and is expected to have a damaging effect on the intimal cells and medial structure of the small cerebral arteries, in consequence of increased shear stress at the vascular interface. Such (high pulsatile) shearing stresses have been detected by Bateman [9,10] and Henry Feugeas et al. [11] in regions of white matter intensity, associated with evidence of small vessel damage and microhemorrhage. They described the findings as evidence of “pulse wave encephalopathy” and linked this with Alzheimer’s disease as did Stone et al. [8] as causing “pulse wave encephalopathy” and microbleeds which contribute to age-related dementia [36,37]. Our group [7,8,12] have pointed out that greater adverse effect of aging on pressure and flow pulsations in females than in males both in the brain, causing ministrokes and at the heart, causing cardiac failure in older persons. Ill effects of aging on the heart and brain are due predominantly to aortic stiffening and increased aortic PWV – with early return of wave reflection from peripheral reflecting sites throughout the systemic circulation (Figure 7) [2–4].
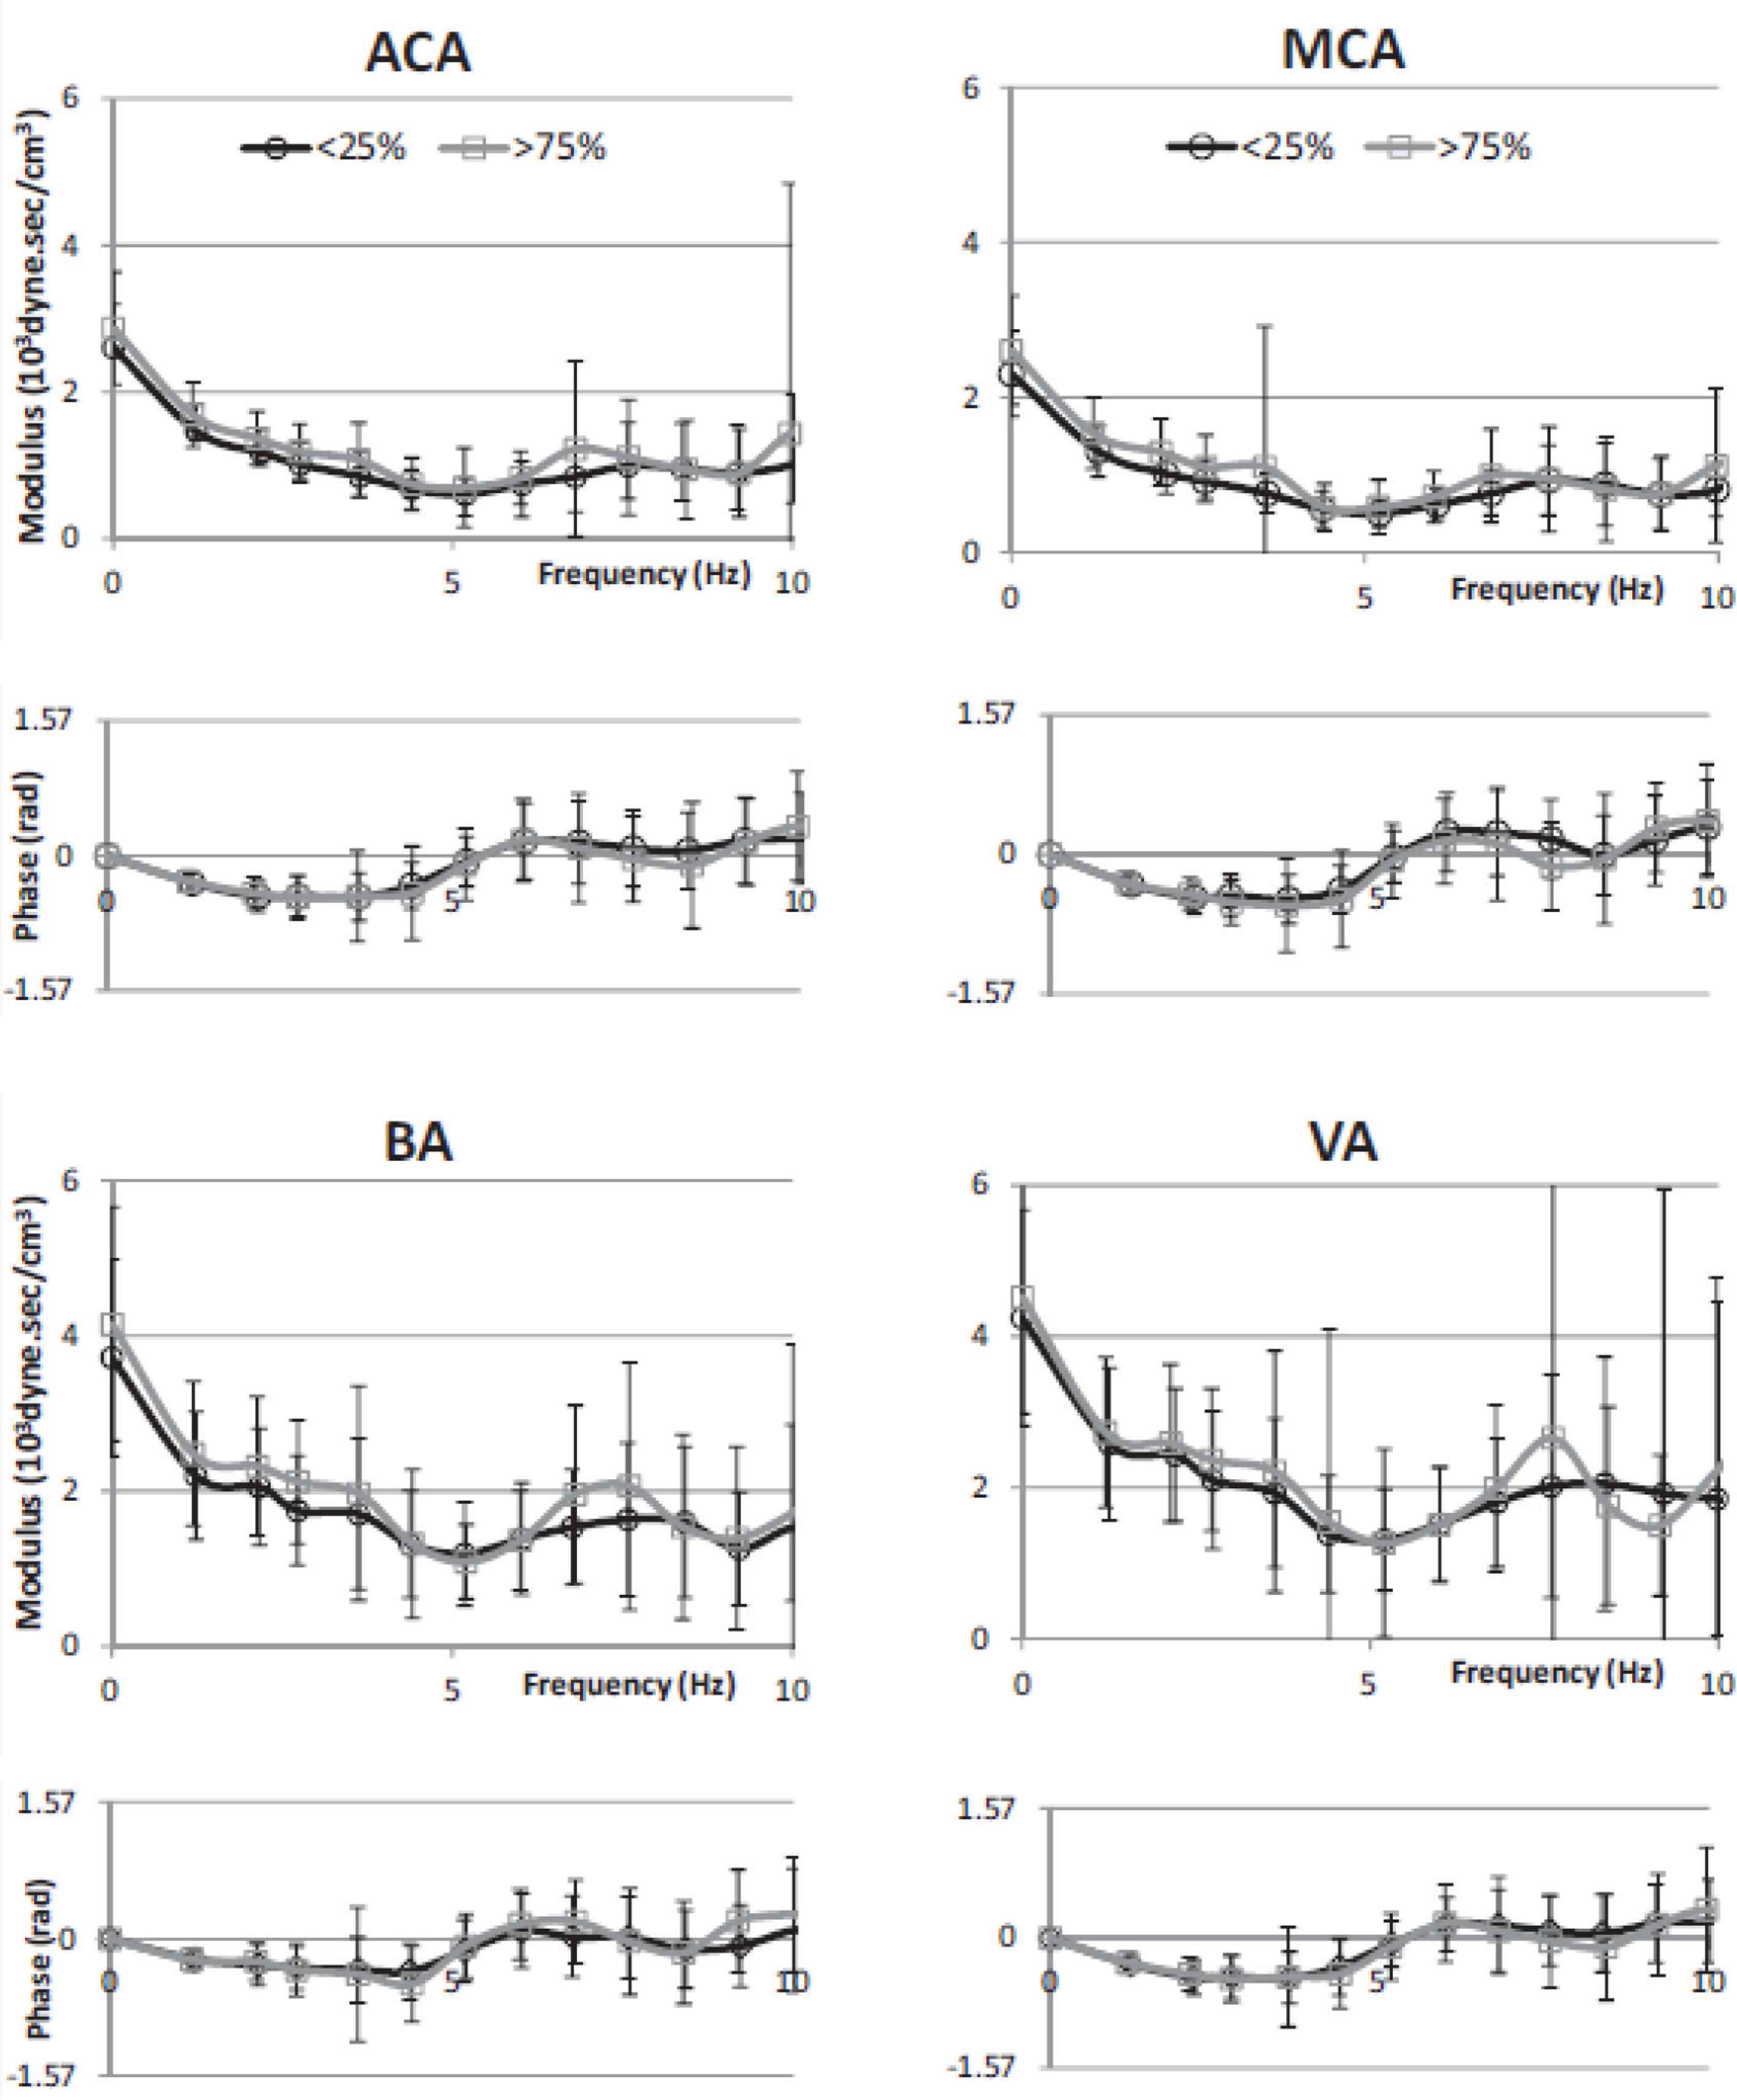
Cerebral vascular impedance for lowest age quartile (black) are compared to that of the highest age quartile (grey) in 1020 normal subjects. Data presented with mean and ±1 SD for modulus and phase plotted against frequency. From Kim et al. [12].
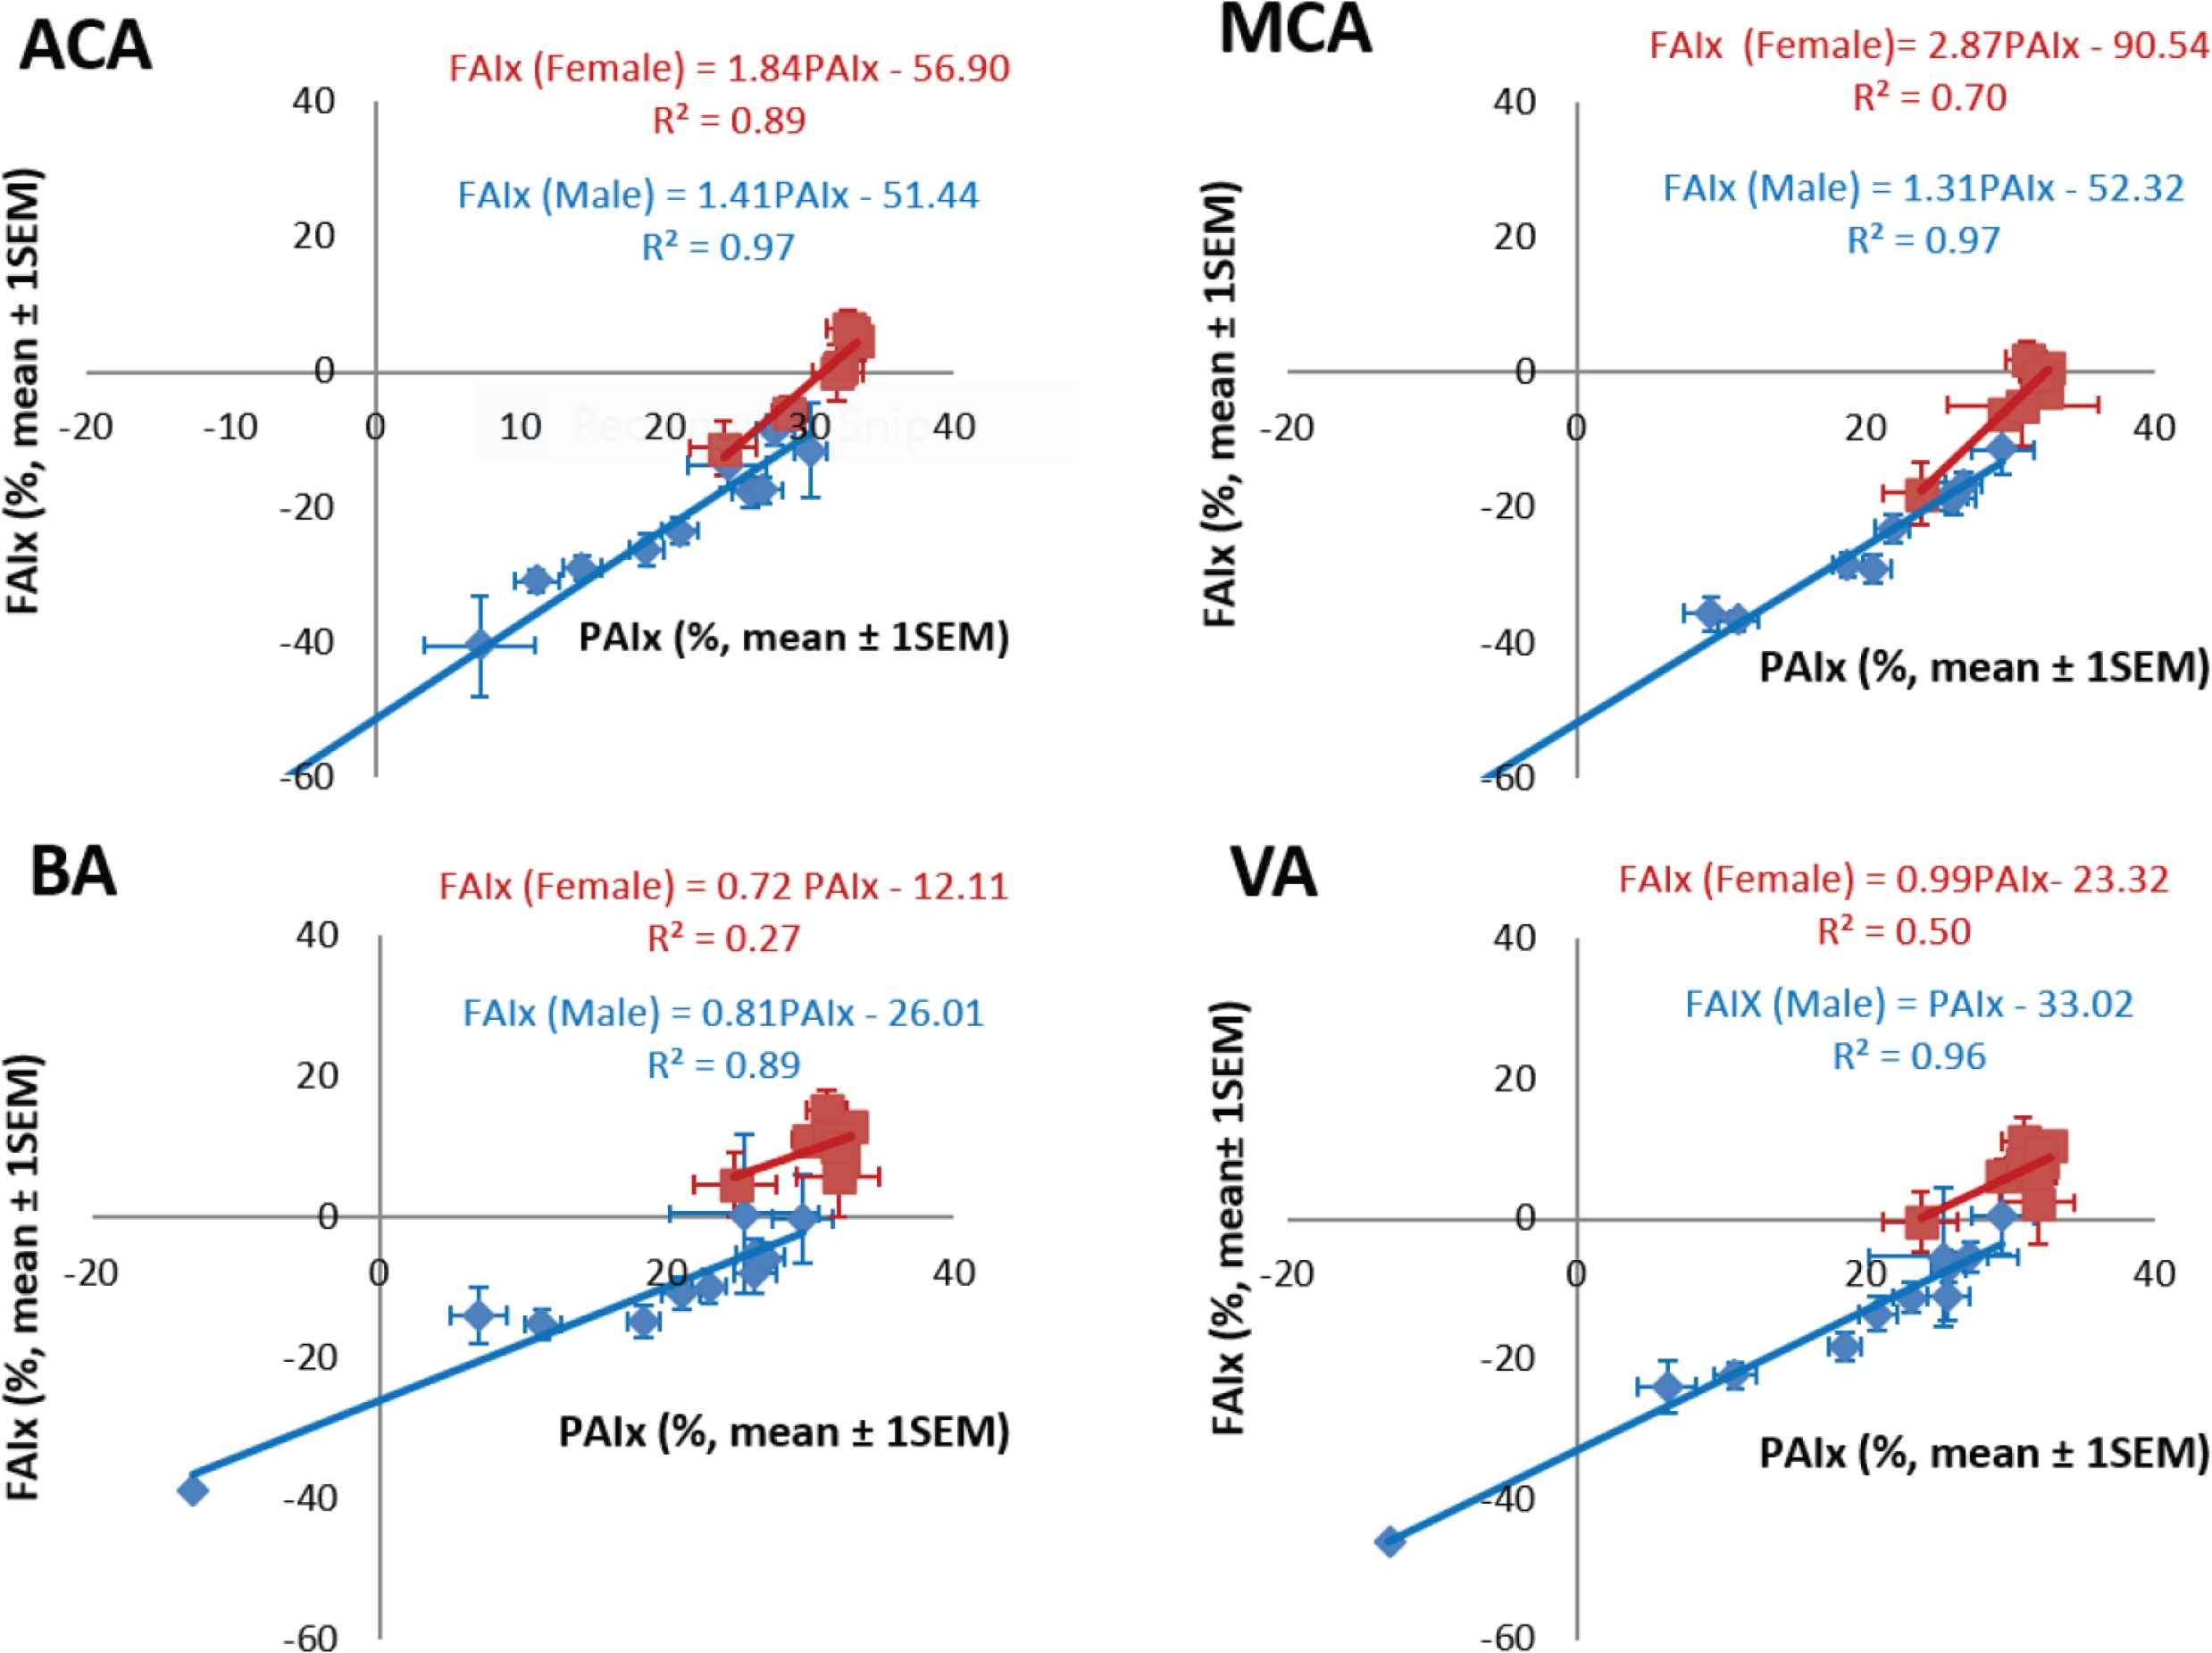
Relationship between Flow Augmentation Index (FAIx) and Pressure Augmentation Index (PAIx) of transcranial flow waves recorded in the Anterior Cerebral Artery (ACA), Middle Cerebral Artery (MCA), Basilar Artery (BA) and Vertebral Artery (VA), of 1020 apparently normal subjects from Shanghai (Kim et al. [12]). Red symbols – females, blue symbols – males.
5. WAVE REFLECTION IN THE CEREBRAL CIRCULATION: BASIS FOR NON-INVASIVE MEASUREMENT OF INTRACRANIAL PRESSURE
Under normal circumstances, in human subjects, pressure within the cranium and spinal canal is low (5–10 mmHg, or 7–15 cm of CSF) in the midline. Normally, this approximates the pressure in midline venous structures within the cranium. Typically in neurological practice, when ICP needs be measured or CSF obtained for pathological analysis, a needle is inserted in the midline of the back between lumbar vertebrae, with the patient lying on his/her side and with the body flexed. Under normal conditions, CSF looks like water, and flow out of the aspirating needle or cannula is gently pulsatile rising to around 10 cm from its nadir to peak with each pulse. In conjunction with other procedures, neurosurgeons measure ICP with a needle or cannula from the brain substance or lateral ventricle. In neurosurgical intensive care units, ICP is commonly measured through a small burr hole in the cranium for several days following elective surgery or after head injury using intraparenchymal pressure microsensor [38]. There is risk of bleeding, neurological damage and infection with invasive procedures. To date, several methods have been developed for measuring ICP non-invasively, although all of them have rather limited accuracy [38,39]. We describe here a new method which is based on interpretation of changes in shape of arterial pressure and flow waves which enter the cranium when ICP is elevated, and which can be explained on the basis of change in wave reflection which accompanies rise in ICP [40–43]. Specifically the method is based on a change from very low wave reflection from the cerebral circulation under normal conditions, and a substantial rise in wave reflection from cerebral arteries where they enter the cranium, when ICP is increased. The method is new, and patent protection has been sought [44]. The method for non-invasive estimation of ICP is based on the change of wave reflection at the cranium from its normal low value (0–0.5) toward 1.0. Students with training in physics (which is not on the curriculum of most modern medical schools) will have an advantage in understanding the underlying mechanisms.
Elevation of ICP is usually caused by intracranial pathology such as brain inflammation, abscess, and tumour. It commonly follows trauma, especially closed head injury from a motor vehicle accident. It may be caused by obstruction of CSF flow through its normal pathway from lateral ventricle to spinal canal and back over the hemisphere where it is absorbed by arachnoid villi; such a problem can present in infancy from hydrocephalus (swelling of the head from accumulation of fluid in the cranium). Hydrocephalus can occur in adults from obstruction of the CSF circulation by tumour or scar. A curious condition of “normal pressure hydrocephalus” may be caused by mixture of CSF circulatory reserve deficit and brain atrophy as a consequence of degeneration of specialised brain cells.
6. THE METHOD FOR NON-INVASIVE INTRA-CRANIAL PRESSURE MEASUREMENT
The largest study of pressure and flow waves entering the cranium to perfuse the brain was conducted initially by Drs. Li, Wang and colleagues in Shanghai as part of an investigation on hypertension in Chinese communities [35]. Persons entered were those undergoing 24-h blood pressure measurement where there was uncertainty as to whether they qualified as having hypertension. On attendance at the Ruijin Hospital for return of 24 h blood pressure recording equipment, subjects had measurement of pressure waveforms from the radial artery by applanation tonometry, with use of an FDA-validated GTF to generate the calibrated central aortic pressure waveform. This was taken to represent the pressure wave on entry to the internal carotid artery or its branches – the anterior and middle cerebral artery or the vertebral or basilar artery. Flow was measured using transcranial Doppler from the anterior, and middle cerebral artery, and from the vertebral and basilar artery, on each side. Our group in Sydney continued analysis of this data set from subjects whose 24-h blood pressure was normal [12]. We focussed on measuring cerebral arterial pressure using applanation tonometry to record the radial artery pulse and a GTF to convert this to what we would expect to record in the central aorta as a surrogate of carotid pressure [12,35].
There was similarity between ensemble-averaged pressure and flow waves at all four sites and at all ages (Figure 2). Better quality signals with least noise were recorded at the anterior cerebral and middle cerebral artery sites. Basilar and vertebral artery waveforms were of lower amplitude and carried more noise. Typically, there were two fluctuations in pressure and flow during systole before the cardiac incisura which represented aortic valve closure and a further blunted peak in diastole. The first systolic peak or shoulder of flow waveforms had the same timing as the pressure wave and was considered to represent the peak of LV ejection, while a late systolic peak of flow with similar timing was considered to represent the peak of wave reflection returning from the lower part of the body. Ejection duration was similar when measured from the different waveforms (Table 3). Changes with age were similar in the middle and anterior cerebral arteries, and corresponded to those recorded for pressure in the radial and central arterial sites. There was a similar relationship between pressure augmentation index and flow augmentation index for all arteries and all decades of age (Figure 7).
| (ms) | Central BP | Radial BP | MCA | ACA | BA | VA | ||||||
|---|---|---|---|---|---|---|---|---|---|---|---|---|
| Mean | SD | Mean | SD | Mean | SD | Mean | SD | Mean | SD | Mean | SD | |
| T1 | 94.8 | 9.4 | 98.7 | 14.5 | 89.3 | 10.9 | 90.4 | 13.7 | 87.1 | 10.8 | 88.3 | 11.3 |
| T2 | 217.3 | 21.2 | 209.4 | 21.8 | 196.7 | 23.7 | 196.4 | 24.8 | 192.4 | 25.4 | 194.5 | 25.8 |
| ED | 311.7 | 21.5 | 311.9 | 21.9 | 311.6 | 22.4 | 307.5 | 22.1 | 299.7 | 24.2 | 298.9 | 23.8 |
Time (ms) from foot of the wave to first peak (T1), second peak (T2), and to dicrotic notch (ED) is computed from flow and arterial pressure pulse waveforms by using SphygmoCor process. Although, pressure and flow pulses were measured sequentially, T1, T2, and ED are in the statistically acceptable ranges (p = 0.8–0.9). ACA, anterior cerebral artery; BA, basilar artery; BP, blood pressure; MCA, middle cerebral artery; VA, vertebral artery.
Timing indices estimated from derived aortic pressure and cerebral arteries flow waveforms. From Kim et al. [12].
Pressure and flow relationship were described in the frequency domain as modulus and phase of impedance (Figure 6). Values were very similar for the anterior and middle cerebral arteries up to 10 Hz whereas there was a similar pattern but more variability in impedance values determined from the smaller and less accessible basilar and vertebral arteries. Impedance modulus revealed a minimum value at 4–6 Hz after falling from its value at 0 Hz (the cerebral vascular resistance). Impedance phase – negative and close to zero at low frequencies, crossed zero at around 5 Hz. These values are similar to those seen in other vasodilated beds such as the kidney and lung or in a limb during vasodilation from reactive hyperemia or intra-arterial infusion of acetyl choline [45]. Averaged reflection coefficient of the vascular beds were similar −0.40 for anterior cerebral artery, 0.41 for middle cerebral artery, 0.58 for basilar artery and 0.40 for vertebral artery. Values of wave reflection coefficients were lower still, approaching zero when allowance was made for amplification between aorta and carotid artery [1]. There was no sex or age difference of impedance modulus or phase (Figure 6); this stands in strong contrast to the difference seen in the ascending aorta – especially for age. Data are also shown in Figure 6 for all arteries, and for males and females considered separately. This implies that age-related small arterial disease in the brain, so obvious in MRI scans and studies, is not caused primarily by cerebral artery aging but is a consequence of thoracic aortic stiffening, with early wave reflection and increase in pressure and flow pulsations that enter the cranium. Such increase in amplitude of pressure and flow waves, especially in their late systolic peak, are more marked in women than in men, and again manifest as boosting of the late systolic peak of pressure and flow caused by early return of pressure and flow waves from the lower body.
Perhaps one should not be surprised by this finding. Cerebral arteries are usually considered as muscular, rather than elastic. Muscular conduit arteries such as the radial or brachial show little or no aging changes in stiffness [46,47].
Cerebral arterial hemodynamics were studied in a group of eight patients being treated for acute head injury according to standardised protocols in the neurosurgical intensive care ward at Addenbrookes Hospital, University of Cambridge [40]. Pressure was monitored in the radial artery at the wrist by intra-arterial catheter, and middle cerebral artery flow velocity was measured transcranially by a Doppler flowmeter sensor [40]. All patients exhibited “Plateau waves” – i.e. periods lasting several seconds up to 30 min when monitored ICP rose to a plateau then fell. Such plateau waves occur spontaneously in patients with raised ICP [48] and there was no indication of cause or trigger. We concentrated on changes in hemodynamics between basal conditions (between or after plateau waves), and recordings near the peak of the plateau (Table 4).
| Patient no. | Central aortic pressure (SEM) | Cerebral perfusion pressure (SEM) | Intracranial pressure (SEM) | Intracranial pulsations (SEM) | ||||||||||||
|---|---|---|---|---|---|---|---|---|---|---|---|---|---|---|---|---|
| Baseline | Plateau | Baseline | Plateau | Baseline | Plateau | Baseline | Plateau | |||||||||
| 1 | 88.9 | 0.5 | 93.0 | 0.5 | 62.4 | 1.8 | 35.4 | 1.2 | 30.9 | 0.1 | 61.0 | 0.3 | 9.3 | 0.1 | 31.2 | 0.2 |
| 2 | 81.9 | 0.7 | 84.4 | 0.7 | 42.3 | 1.3 | 30.6 | 1.2 | 37.9 | 0.3 | 52.8 | 0.5 | 16.4 | 0.5 | 26.7 | 0.6 |
| 3 | 94.5 | 0.6 | 98.8 | 0.7 | 61.0 | 1.3 | 49.6 | 1.1 | 31.7 | 0.2 | 44.1 | 0.3 | 7.6 | 0.2 | 13.7 | 0.6 |
| 4 | 81.5 | 0.6 | 75.2 | 0.6 | 61.5 | 1.6 | 22.2 | 1.2 | 19.6 | 0.1 | 53.4 | 0.3 | 2.9 | 0.1 | 16.0 | 0.2 |
| 5 | 91.3 | 0.6 | 92.8 | 0.6 | 56.4 | 1.3 | 34.7 | 1.0 | 31.0 | 0.2 | 56.5 | 0.4 | 7.7 | 0.2 | 20.8 | 0.4 |
| 6 | 79.9 | 0.6 | 88.9 | 0.6 | 66.1 | 1.5 | 35.4 | 1.0 | 18.4 | 0.2 | 53.6 | 0.3 | 4.8 | 0.2 | 19.0 | 0.3 |
| 7 | 104.4 | 0.9 | 85.2 | 0.8 | 72.3 | 2.9 | 42.5 | 1.8 | 30.8 | 0.1 | 45.2 | 0.3 | 6.9 | 0.2 | 12.0 | 0.3 |
| 8 | 95.2 | 0.6 | 96.1 | 0.7 | 63.7 | 1.8 | 38.7 | 0.9 | 30.3 | 0.2 | 56.1 | 0.4 | 8.8 | 0.3 | 23.9 | 0.4 |
| Average | 89.7 | 89.3 | 60.7 | 36.1 | 28.8 | 52.8 | 8.1 | 20.4 | ||||||||
 |
|
|
||||||||||||||
| p < 0.01 | p < 0.01 | p < 0.01 | ||||||||||||||
| Patient no. | MCA mean flow velocity (SEM) | MCA systolic flow velocity (SEM) | MCA diastolic flow velocity (SEM) | MCA pulsatile flow velocity (SEM) | Flow pulsatility index (SEM) | |||||||||||||||
|---|---|---|---|---|---|---|---|---|---|---|---|---|---|---|---|---|---|---|---|---|
| Baseline | Plateau | Baseline | Plateau | Baseline | Plateau | Baseline | Plateau | Baseline | Plateau | |||||||||||
| 1 | 57.9 | 0.3 | 50.4 | 1.1 | 103.1 | 0.8 | 129.8 | 1.4 | 31.1 | 0.2 | 23.0 | 0.5 | 72.1 | 0.8 | 106.8 | 1.3 | 1.20 | 0.01 | 2.10 | 0.03 |
| 2 | 43.2 | 1.8 | 30.2 | 1.5 | 128.7 | 1.7 | 110.7 | 5.1 | 22.6 | 0.4 | 16.5 | 0.5 | 106.0 | 1.8 | 94.2 | 1.8 | 2.40 | 0.04 | 3.10 | 0.04 |
| 3 | 44.7 | 1.5 | 45.3 | 2.0 | 120.6 | 2.0 | 150.7 | 2.5 | 23.9 | 0.7 | 19.9 | 0.6 | 96.7 | 2.0 | 130.8 | 3.0 | 2.10 | 0.03 | 2.80 | 0.06 |
| 4 | 55.8 | 1.0 | 33.9 | 1.5 | 98.9 | 2.5 | 113.1 | 1.6 | 36.5 | 1.6 | 14.5 | 0.4 | 62.4 | 2.6 | 98.6 | 1.7 | 1.10 | 0.05 | 2.90 | 0.05 |
| 5 | 46.5 | 1.3 | 29.8 | 1.4 | 96.8 | 1.8 | 84.5 | 1.5 | 29.3 | 0.4 | 13.6 | 0.2 | 67.6 | 1.7 | 70.9 | 1.5 | 1.40 | 0.03 | 2.40 | 0.05 |
| 6 | 22.0 | 0.6 | 23.9 | 0.9 | 52.7 | 1.1 | 62.7 | 0.4 | 8.4 | 0.6 | 5.4 | 0.7 | 44.3 | 0.8 | 57.3 | 1.0 | 2.00 | 0.09 | 2.40 | 0.05 |
| 7 | 111.2 | 1.5 | 78.9 | 2.2 | 165.5 | 2.1 | 177.1 | 3.4 | 76.9 | 1.6 | 48.5 | 0.6 | 88.6 | 2.4 | 128.6 | 3.8 | 0.80 | 0.03 | 1.50 | 0.04 |
| 8 | 44.3 | 1.3 | 27.3 | 1.7 | 97.0 | 1.8 | 105.4 | 1.7 | 26.4 | 0.7 | 11.5 | 0.3 | 70.6 | 1.8 | 93.9 | 1.6 | 1.60 | 0.05 | 3.30 | 0.06 |
| Average | 53.2 | 40.0 | 107.9 | 116.8 | 31.9 | 19.1 | 76.0 | 97.6 | 1.6 | 2.6 | ||||||||||
|
|
|
|
|||||||||||||||||
| p = 0.01 | p < 0.01 | p = 0.01 | p < 0.01 | |||||||||||||||||
MCA, middle cerebral artery; SEM, standard error of mean.
Data summarized for arterial pressure and cerebral flow. From Kim et al. [40]
Conventional analysis of data showed no definite clue as to what if any change in pressure or flow waveforms are associated with or caused by raised intracranial pressure. There were no significant changes in radial or central arterial pressure waves and no change in heart rate. However, there was an exponential relationship between ICP pulsations and mean ICP (Figure 8). CPP fell from mean 66 to 35 mmHg, but this was expected with unchanged systolic pressure and increased ICP. There was no convincing difference in impedance modulus or phase between baseline and plateau but both were consistent with increase in wave reflection. There was a small but insignificant increase in pressure AIx between baseline and plateau; at plateau, ICP pulsations increased substantially from 29 to 53 mmHg and the ICP waves approached the amplitude and contour of the central arterial pressure waves. ICP never exceeded central aortic pressure.
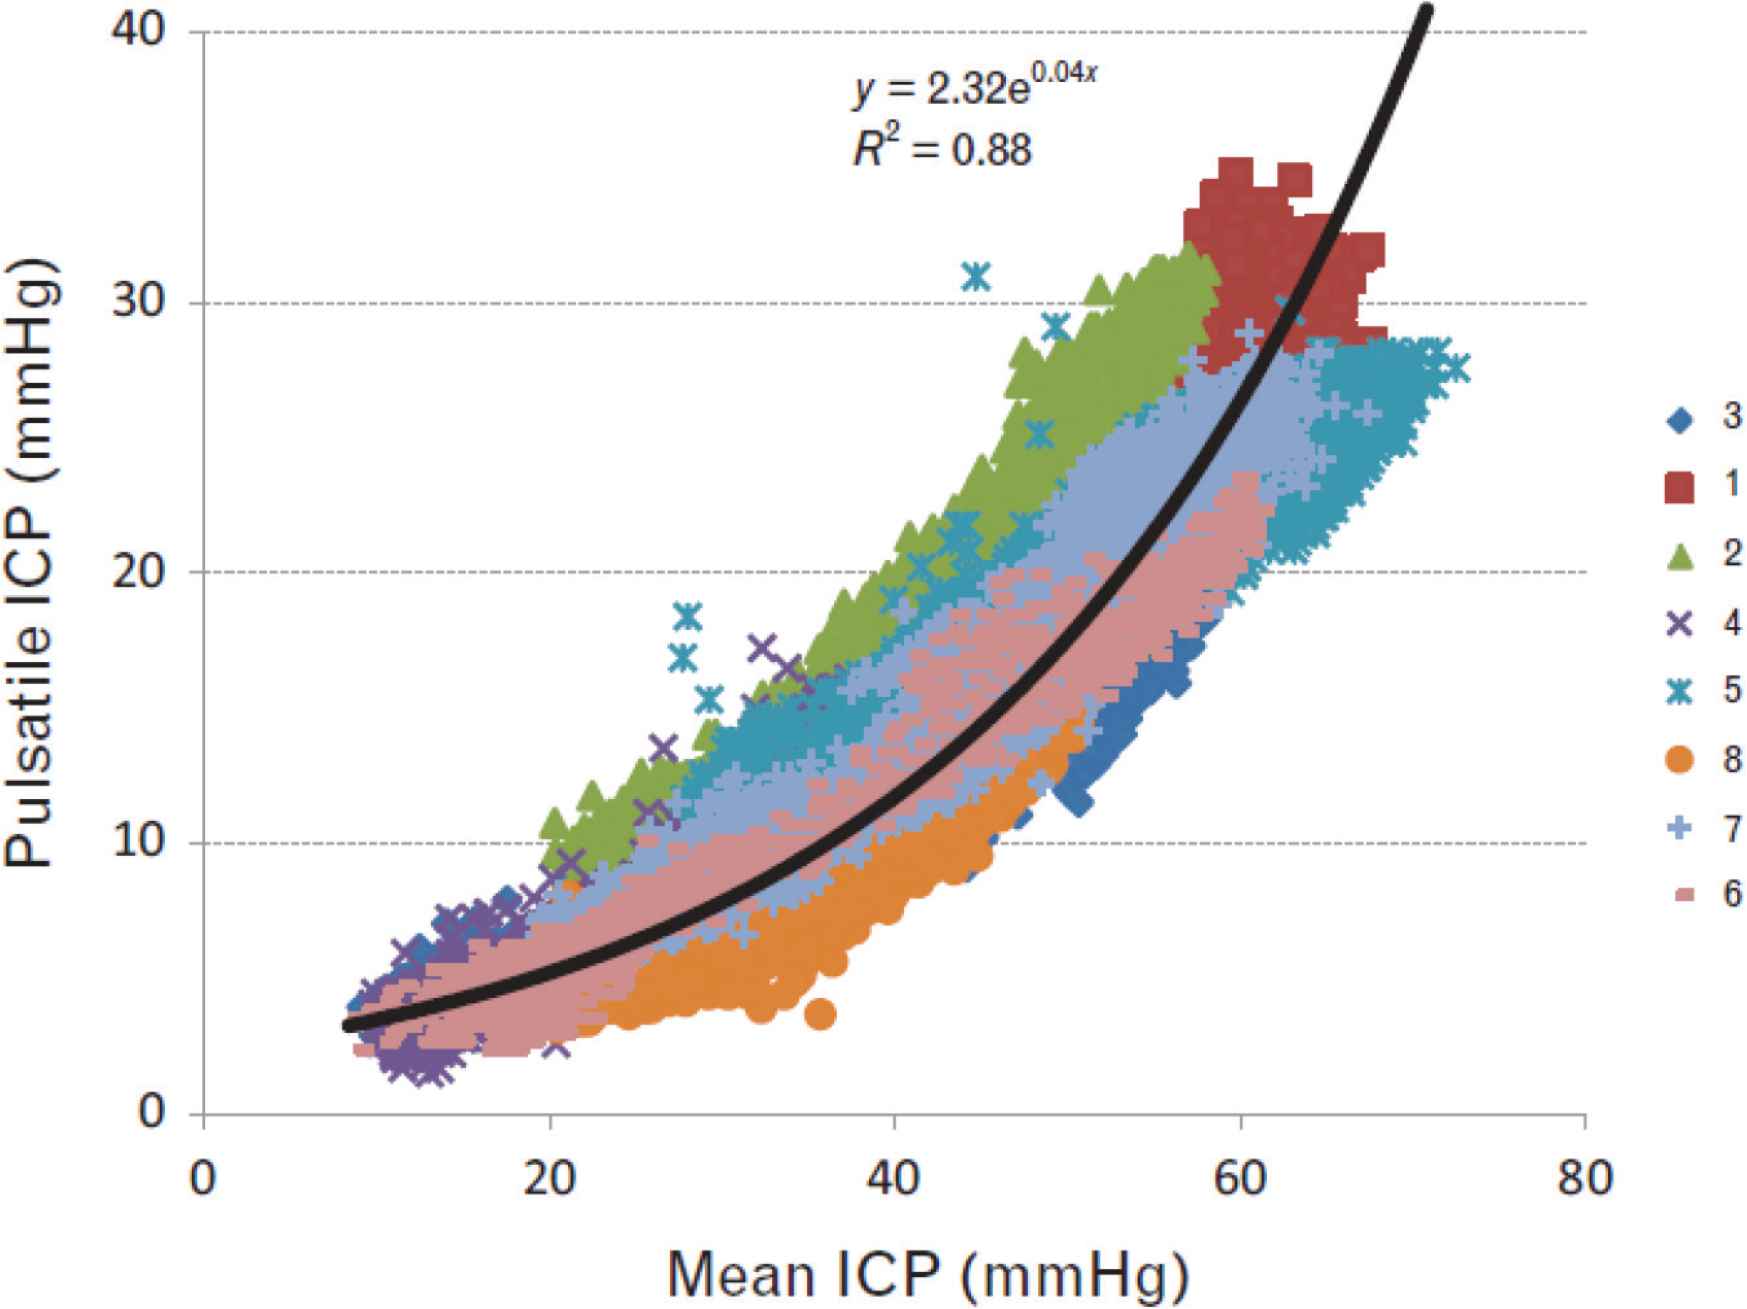
Relationship between mean and pulsatile ICP at baseline and with elevation of ICP during ‘plateau waves’ of all (>70,000 digitised waves) of eight patients. Pressure pulsations were directly related to mean ICP. The relationship is seen down to normal levels where mean ICP and pressure fluctuations are small and <10 mmHg. From Kim et al. [40].
Figure 9 shows pressure waveforms for radial artery pressure, central aortic pressure and ICP in one patient with normal pressure hydrocephalus [42]. This showed the low amplitude of ICP compared to radial or central aortic pressure. However, when all waves were normalised to the same pressure, there was a positive pressure gradient between the ICP and the central aorta in systole, whereas in diastole, central arterial pressure fell below ICP.
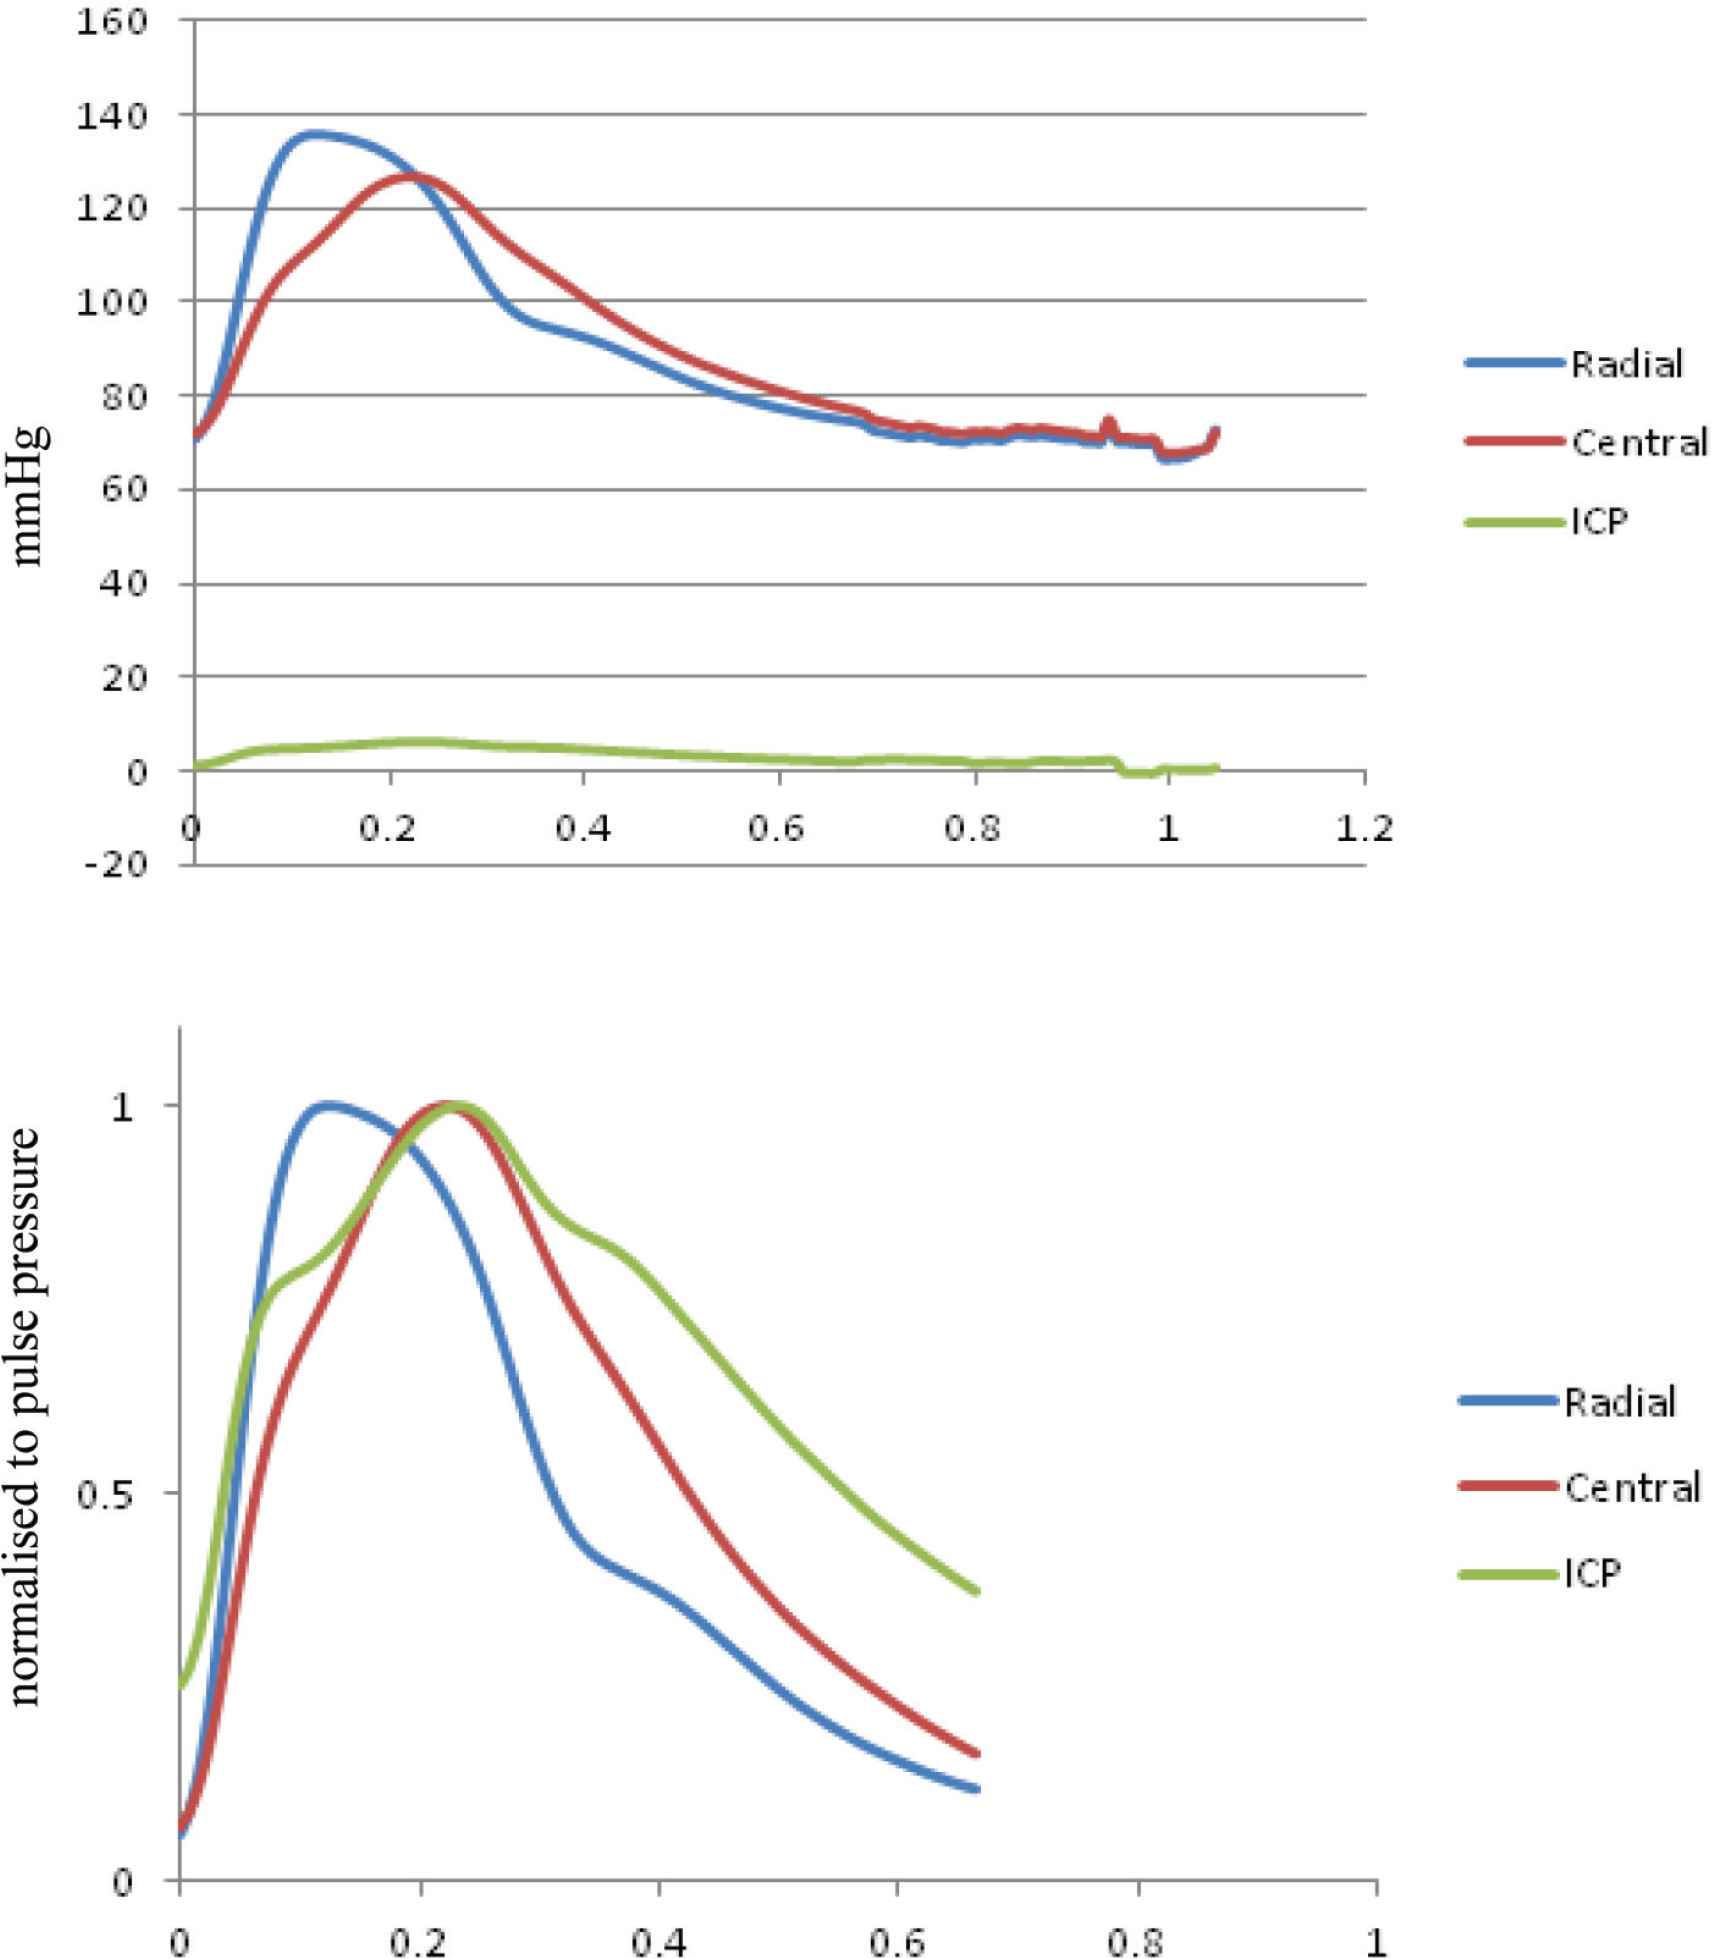
(Top) Interaction between radial artery pressure (blue), central aortic pressure (red), and intracranial pressure (ICP) (green) recorded simultaneously under normal condition with the same pressure calibration. ICP waves are very small compared to arterial pressure waves. (Bottom) Relationships of the three waveforms when peak of the wave were scaled to the same pulse pressure. The ICP wave has the same basic waveform shape as the central pressure waveform with an early systolic shoulder and late systolic pressure peak. From Kim et al. [42].
The data described above provides some clues that wave reflection from or within the cranium may provide a method for measuring ICP non-invasively. Such a view is strengthened by other data which show late systolic augmentation of the central arterial waveform and decrease in apparent LV ejection duration measured from the flow but not the pressure waveform, and data from Doppler which shows abundant turbulence in flow during diastole, and negative flow during much of diastole (even “reverberation”) [49]. This led us to seek an explanation of cerebrovascular hemodynamics associated with rising ICP. We began with review of our data from the eight patients with known ICP, and focussed on how the observed features developed. This is set out in Figure 10 where ICP pressure and MCA velocity are graphed against mean ICP as this rises from zero to mean of 80 mmHg. There were no surprises with systemic pressure measurements. Brachial systolic pressure remained normal before rising when ICP systolic exceeded 60 mmHg. Central aortic pressure calculated from radial waveforms and brachial pressure rose to a lesser degree, whereas ICP (of course) rose in near linear fashion.
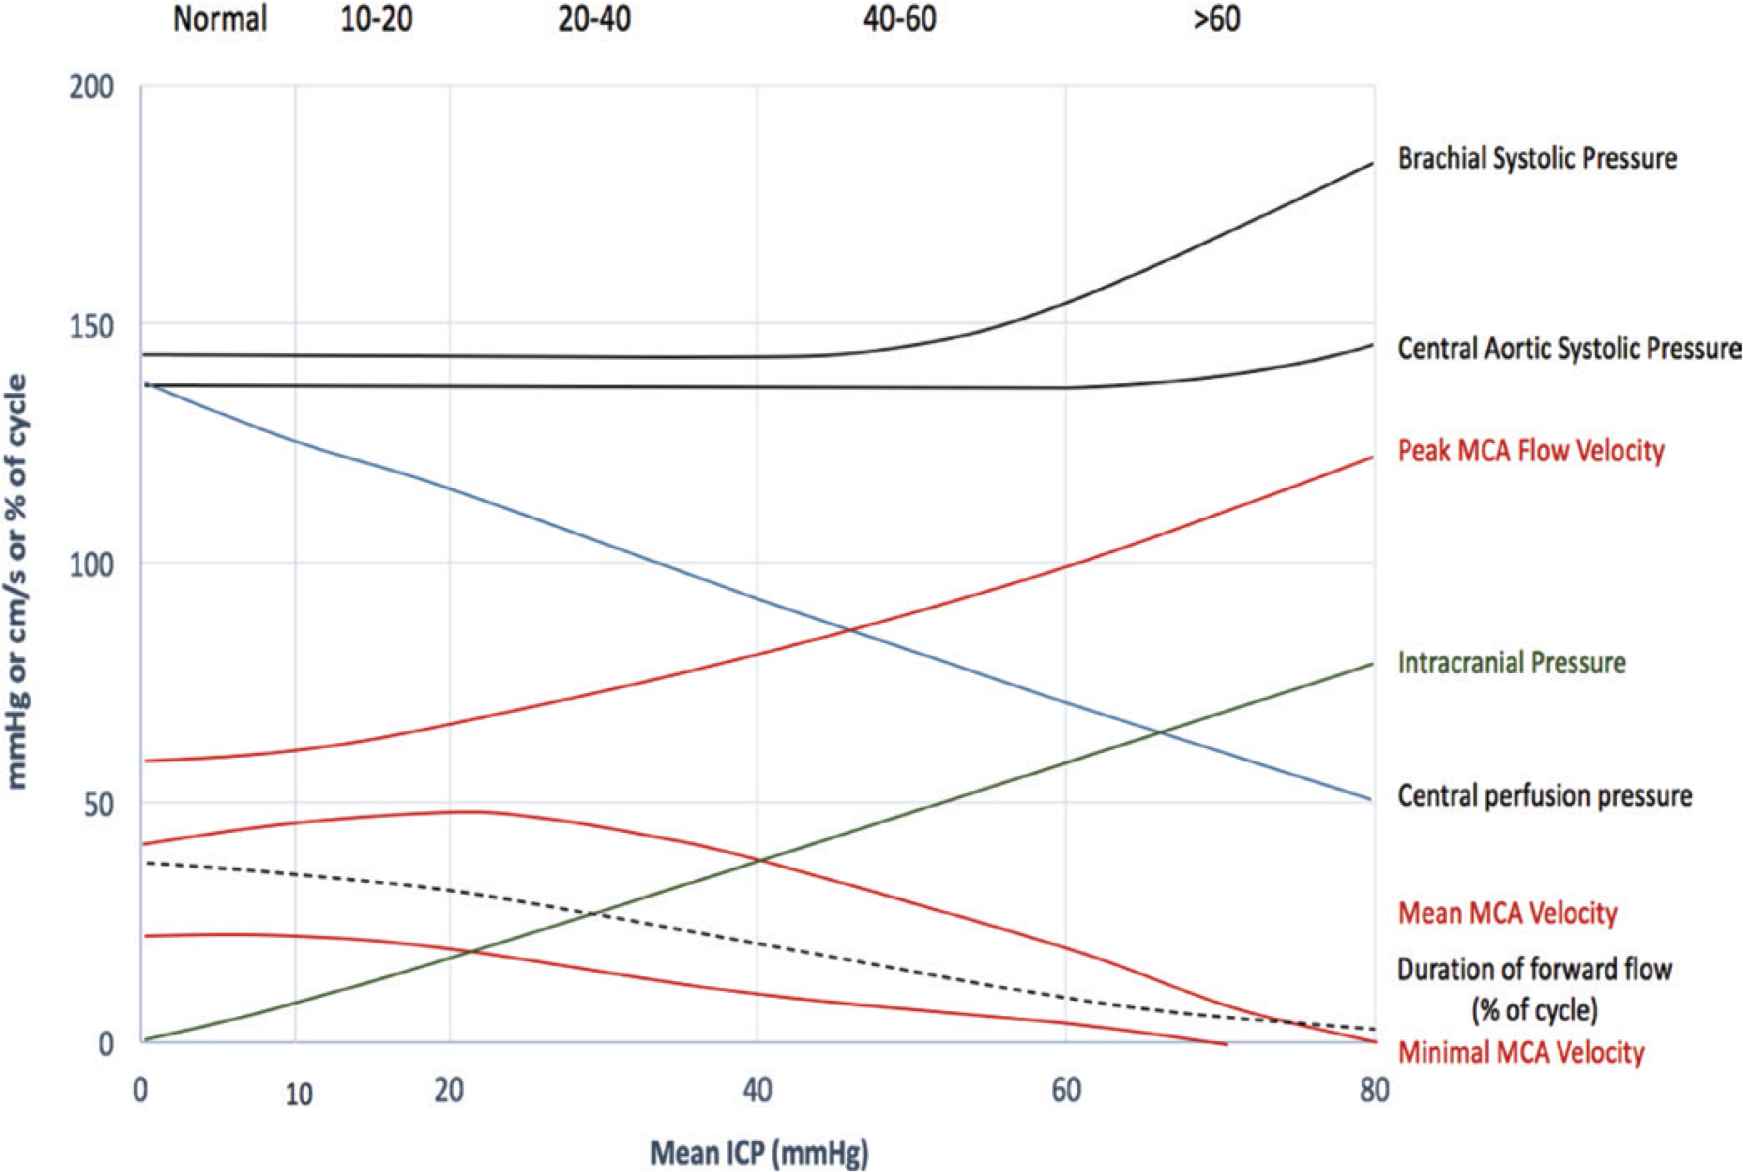
ICP pressure and MCA velocity are graphed against mean ICP as ICP rises from zero to mean of 80 mmHg. Pulse 2016 by Lim et al. [43], and presented at the Pulse of Asia 2016/2017 scientific meeting.
The principal changes were with flow velocity and flow waveforms. Peak MCA flow velocity rose almost linearly up to ICP 60 mmHg, then becoming uninterpretable, suggesting flow turbulence. The most obvious change, when graphed in this way was with minimal flow velocity which remained around 20 cm/s to ICP 20 mmHg, then fell steadily to 0 cm/s around ICP 60 mmHg. While this change in flow velocity was seen with analysis of transcranial Doppler, previous studies have shown the same phenomenon, but were usually interpreted as noise and turbulence when diastolic flow is low or unstable.
These findings led us to search for a comprehensive explanation, and we appear to have found this from the phenomenon of flow waveform reflection within the cranium as a consequence of progressive elevation of ICP sufficient to narrow and occlude intracranial arteries. Compression of intracerebral arteries by pressure elevation in the skull causes widespread narrowing of these cerebral vessels with increase in cerebral vascular resistance and impedance. Increased impedance and resistance causes increased wave reflection where the cerebral arteries enter the cranial vault. Such increased resistance is apparent in two ways – the first is increase in augmentation not only of the arterial pressure waves which enter the cranium, but the ICP waves as well in later systole. The second and most convincing evidence of increased wave reflection is the opposite effect on the flow waves, causing progressive narrowing of all the arteries which enter the cranium with initial increase in flow velocity, then progressive decrease in peak velocity and in the period of forward flow into the cranium (Figure 11). At the extreme of this process, forward flow ceases during systole with evidence of reverse flow during diastole, together with chaotic turbulent flow, even “reverberation”. In extreme cases, with arterial obstruction nearly complete, higher harmonic of pressure and flow waves may become apparent in the general systemic circulation (Figure 12) [2].
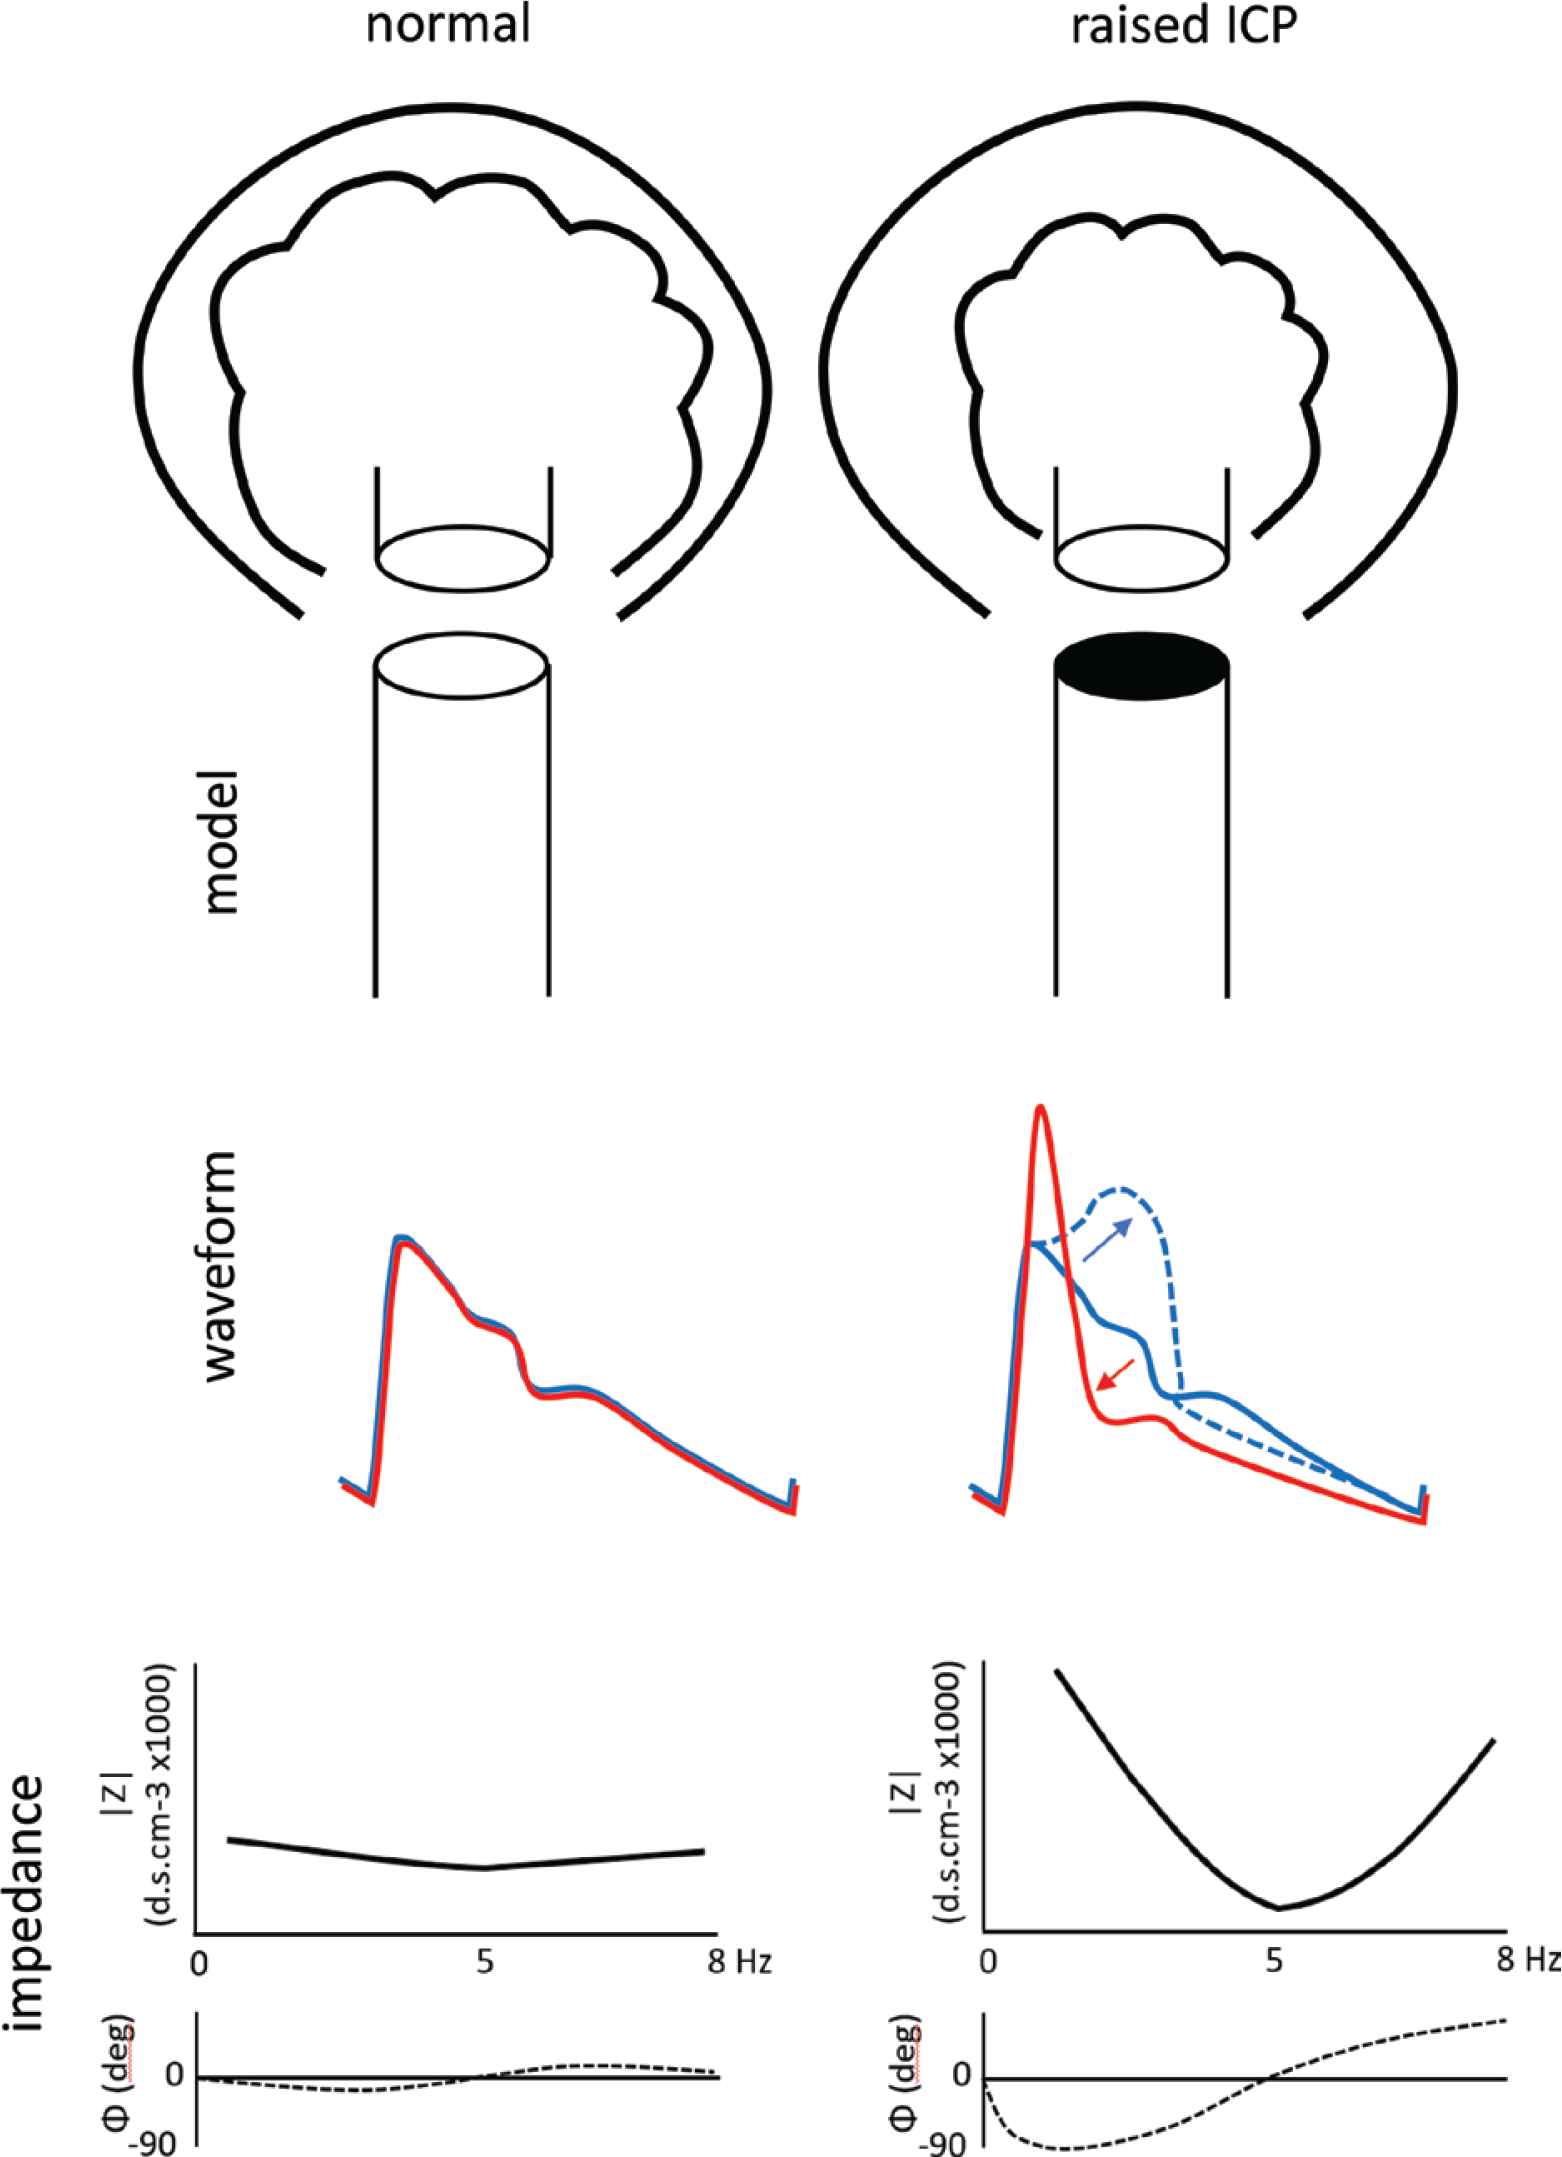
The new methods arise from analysis of pressure and flow waveforms in both time and frequency domains as they approach, then enter the cranium to perfuse the brain, under normal ICP conditions (left), with reflection coefficient close to zero (0%), then (right) with wave reflection rising to approximate 100% as ICP increases toward systemic arterial pressure. With elevation of ICP from its normal value of circa 0–5 mmHg, when reflection coefficient is near zero, to its highest value of circa 50–100 mmHg, increasing wave reflection has diametrically opposite effects on pressure and flow in the cerebral vasculature, boosting pressure in late systole (arrow pointing upward and to right), but supressing flow velocity in early systole after an initial narrow brief high early flow velocity peak (arrow pointing to the left and downward). Other characteristic effects of elevated ICP from high wave reflection within the cranium include:
- •
Deviation of arterial pressure and flow waves from their normal similar shape.
- •
Deviation of cerebral vascular impedance modulus and phase from very low normal values and with increase in fluctuations of both.
- •
Decrease in forward flow duration during early systole, but maintenance in duration of systole measured from the arterial pressure wave.
- •
Initial increase in peak flow velocity pulsation.
- •
Backward (negative) flow in late systole and in diastole when ICP is highest [49].
- •
Ultimate extinction of systolic blood flow into the cranium and brain [49].
- •
Increased fluctuations of pressure and flow in the systemic circulation caused by increased wave reflection in the upper part of the body [2].
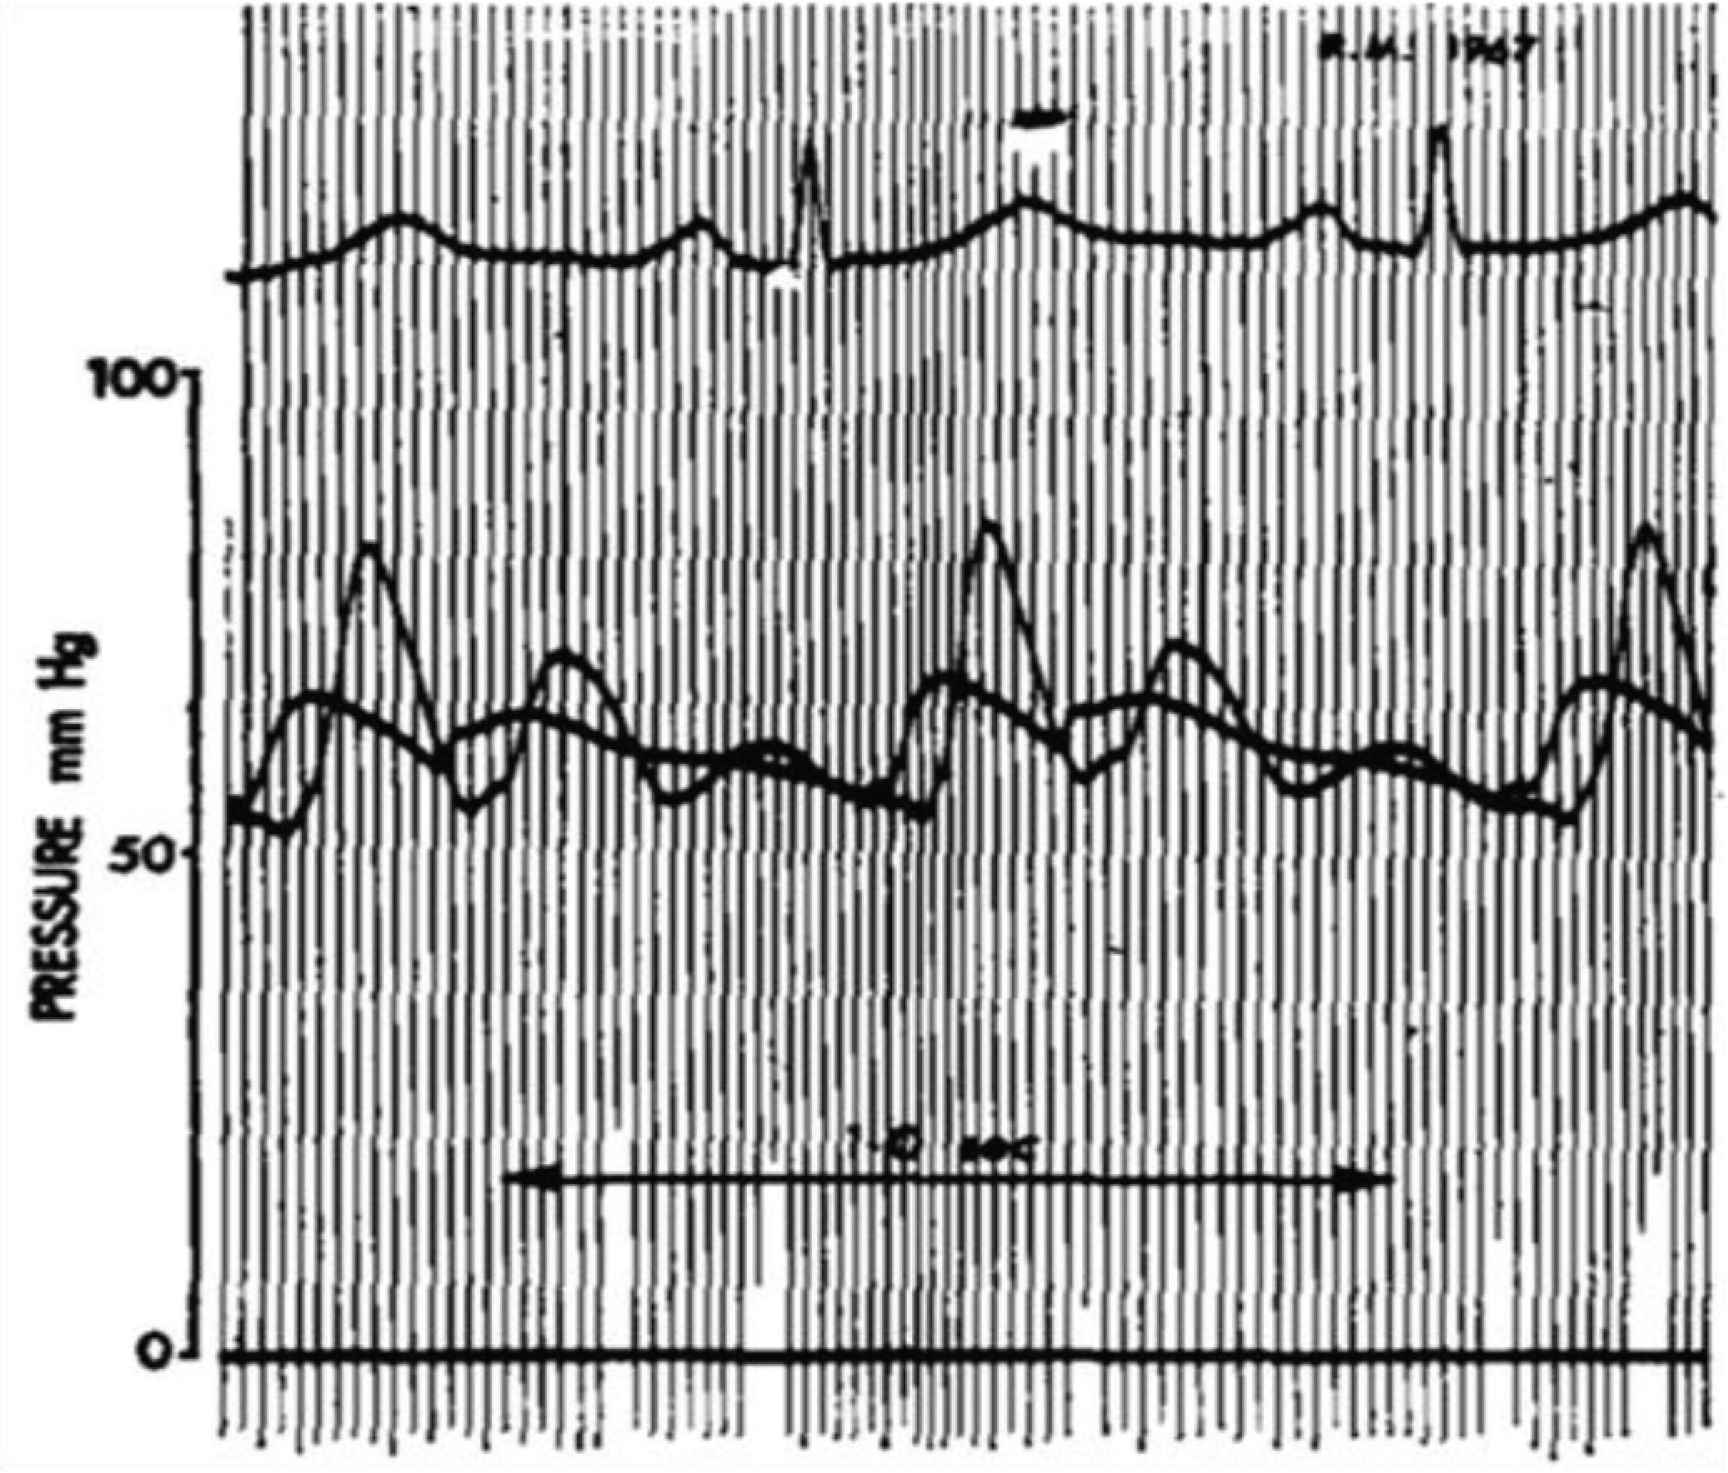
Pressure waves recorded simultaneously in the ascending aorta and radial artery of an older man (circa 65 years) with occlusion of one internal carotid artery and recent cerebral ischemia. Time calibration 1.0 sec. From O’Rourke (Cardiovasc Res, 1970. 4(3): pp. 291–300).
Understanding of this process can lead on to quantification of ICP over the range where monitoring can improve management in neurosurgical intensive therapy unit (ITU). Understanding of the process can also improve ability to identify brain death and so expedite handling of heart transplant donors [43,44]. The key finding of this study is the increase in wave reflection from <0.5 to circa 1.0 and the progressive increase in pressure wave augmentation and progressive decrease in flow wave amplitude and systolic flow period culminating in total cessation of blood flow into the cranium and brain.
CONCLUSION
Peculiarities of the cerebral circulation in humans arise from the need to perfuse the brain reliably in the upright position, while protecting the brain from trauma. Problems can arise with elevation of intracranial pressure to levels where cerebral arteries are narrowed and blood flow compromised, with risk of ischemia and secondary stroke.
We describe here non-invasive methods based on analysis of pressure and flow waves which enter the cranium; these have the potential to measure the degree of intracranial elevation and aid in its management.
CONFLICTS OF INTEREST
Prof. O’Rourke is a founding director of AortaMate Pty. Ltd., Sydney, a company formed to aid measurement of central aortic pressure, development of software for pulse wave analyses and methods to reduce aortic stiffness. Other authors have no disclosure.
ACKNOWLEDGMENT
Dr. Czosnyka is supported by NIHR Biomedical Research Centre, Cambridge, UK.
Footnotes
REFERENCES
Cite this article
TY  - JOUR
AU  - Michael O’Rourke
AU  - Jonathan Stone
AU  - Audrey Adji
AU  - Mi Ok Kim
AU  - Yan Li
AU  - Ji Guang Wang
AU  - Alberto Avolio
AU  - Per Kristian Eide
AU  - Marek Czosnyka
PY  - 2020
DA  - 2020/07/19
TI  - The Human Systemic and Cerebral Circulations: Contrasts in Structure and Function
JO  - Artery Research
SP  - 197
EP  - 211
VL  - 26
IS  - 4
SN  - 1876-4401
UR  - https://doi.org/10.2991/artres.k.200704.001
DO  - 10.2991/artres.k.200704.001
ID  - O’Rourke2020
ER  -