
Role of Adipose Tissue and Skeletal Muscle in Atherosclerosis and in Central Hemodynamics
- DOI
- 10.2991/artres.k.200511.001How to use a DOI?
- Keywords
- Carotid arterial disease; peripheral arterial disease; atherosclerosis; arteriosclerosis; adipose tissue; skeletal muscle
- Abstract
Background: Carotid Arterial Disease (CAD) and peripheral arterial disease (PAD) are atherosclerotic diseases. Adipose tissue (AT) and skeletal muscle (SM) are endocrine organs producing polypeptides with vascular effects. The main objective of this study is to characterize the AT and SM in PAD and CAD. It is also an aim to determine their role in central hemodynamics.
Methods: A prospective, observational, case–control study is being conducted. The study group includes patients with PAD/CAD, with and without surgical indication. The control group includes subjects without PAD/CAD, with indication for elective non-vascular surgery, in order to allow access to samples of AT and SM. The quantity, histology and endocrine function of AT and SM are being determined.
Results: From December 2018 to August 2019, 47 PAD were studied: 33 with Intermittent Claudication (IC) - (28 male; age: 67.24 ± 9.97 years) and 14 Critical Limb Ischemia (CLI) - (seven male; age: 69.21 ± 8.33 years). CLI patients have a lower quantity of SM and higher quantity of visceral and subcutaneous AT, determined on the CT scan, but these differences were not statistically significant. CLI had significant lower SM strength and density [muscle strength right hand: 22.62 ± 8.20 kgf IC vs. 16.38 ± 7.84 kgf CLI, p = 0,02; SM strength left hand: 21.98 ± 8.98 kgf IC vs. 16.37 ± 8.35 kgf CLI, p = 0.04; SM density: 20.44 ± 11.73 Hounsfield Units (HU) IC vs. 9.04 ± 2.47 HU CLI, p = 0.01].
Conclusion: This preliminary data suggests that CLI patients could have a SM dysfunction, inferred from hand grip strength and SM density. These results would be corroborated with the project development. The novelty of this research is the possibility to study the histology features and endocrine markers of AT and SM and to find an association with artery function, arteriosclerosis an atherosclerosis, in human.
- Copyright
- © 2020 Association for Research into Arterial Structure and Physiology. Publishing services by Atlantis Press International B.V.
- Open Access
- This is an open access article distributed under the CC BY-NC 4.0 license (http://creativecommons.org/licenses/by-nc/4.0/).
1. INTRODUCTION
Peripheral Arterial Disease (PAD) and Carotid Artery Disease (CAD) are manifestations of atherosclerosis [1–3]. PAD presents as Intermittent Claudication (IC) and Critical Limb Ischemia (CLI) [1]. CLI is a severe manifestation, presenting as rest pain, ulcers or gangrene [3,4].
Before the establishment of PAD and CAD, patients present subclinical arteriosclerosis and atherosclerosis. Arterial stiffness is a measure of arteriosclerosis, an earlier precursor to atherosclerosis and an independent risk factor for cardiovascular events [5–8].
Skeletal Muscle (SM) and Adipose Tissue (AT) have roles in atherosclerosis and arteriosclerosis. They are considered as endocrine organs, secreting polypeptides with various biological activities (myokines and adipokines, respectively) [6,9]. These polypeptides contribute directly to arterio and atherosclerosis [6,7,9].
This paper describes a research study that aims to clarify the characteristics of AT and SM (quantity, histology and adipokines/myokines expression) in different arteriosclerosis stages and PAD/CAD. In this project the following purposes have also been established: evaluate if the central hemodynamic arterial parameters are influenced by endocrine function of these tissues (AT and SM); investigate the bi-univocal relationship between the endocrine functions of AT and SM with different clinical stages of atherosclerosis, hemodynamic arterial parameters and arterial histology.
2. MATERIALS AND METHODS
2.1. Study Type, Inclusion/Exclusion Criteria
A prospective, observational, case–control study is being conducted. The study group includes patients with different stages of PAD and CAD, with and without surgical indication. The control group includes individuals without PAD and CAD, with indication for elective non-vascular surgery, in order to allow access to samples of AT and SM. The control patients are matched by age, gender and major anatomic surgical site with the cases (Table 1). The exclusion criteria are conditions responsible for body composition changes or pro-inflammatory state (recent diet change, bedridden, active malignancy, auto-immune disease, active infection, chronic renal failure or heart failure in the past 3 months) [10].
| Study group | Control group | |
|---|---|---|
| Cervical adipose/skeletal tissue | Carotid endarterectomy | Thyroidectomy |
| Abdominal adipose/skeletal tissue | Aorto-iliac surgery | Abdominal non-neoplastic urological surgery |
| Femoral adipose/skeletal tissue | Femoral surgery | Varicose veins surgery |
Matching the control subjects with the study patients according to the samples of AT and SM in order to avoid regional and anatomic differences between the tissues.
Study and control groups
The study variables are recorded at admission, 3, 6 and 12 months after study inclusion (Table 2). In order to quantify the AT and SM, anthropometric measures and CT scan are being performed at admission and during the follow up as shown in Table 2. The Carotid-femoral Pulse Wave Velocity (cfPWV), Central Blood Pressure (CBP) and carotid ultrasound, ankle-brachial index are used to evaluate the hemodynamic artery parameters. The hand grip strength is registered to infer the SM function. Samples from AT (subcutaneous, visceral and perivascular) and SM is collected in control and PAD/CAD patients during the surgery. These samples are used to determine the local quantity of myokines, adipokines and histological characteristics. If there is a surgical indication to remove a sample of artery or atherosclerotic plaque, they will be collected and analysed. The circulating levels of adipokines and myokines will also be quantified.
| Variables | Months | |||
|---|---|---|---|---|
| 0 | 3 | 6 | 12 | |
| Comorbidities | x | x | x | x |
| Anthropometric data | x | x | x | x |
| Myokines serum levels | x | x | x | x |
| Adipokine serum levels | x | x | x | x |
| Hand grip strength | x | x | x | x |
| cfPWV | x | x | x | x |
| Central blood pressure | x | x | x | x |
| Carotid ultrasound | x | x | x | x |
| Ankle-brachial index | x | x | x | x |
| Lumbar CT scan | x | x | ||
| Artery sample | x | |||
| Adipose tissue sample different locations | x | |||
| Skeletal muscle sample different locations | x | |||
Data that will be collected during the study. The CT scan will be performed at the admission and at the end of the study (12 months). The samples of adipose tissue and skeletal muscle will be collected in patients with indication to surgery at the beginning of the study.
Schedule for data collection
2.2. Ethical Considerations
Ethics approval for data collection and cohort evaluation was obtained from the Ethics Committee of the Hospital Senhora da Oliveira, Guimarães (75/2017) and by the National Commission for Data Protection. All the participants are signing the informed consent.
2.3. Sample Size Determination and Power Consideration
The sample size was determined according to the levels of adipokines and myokines. Due to the fact that adiponectin is the most well investigated adipokine, the sample size calculation was based on data for this molecule.
In the literature, it has been observed that patients exhibit great variability in adiponectin levels: an adipokine. Gasbarrino et al. reported a median value/interquartile range of 8.54 μg/mL (4.28–23.02) and Dieplinger et al. described a value of 9.50 mg/L (6.30–13.90) for the patients and 10.80 mg/L (7.10–15.00) for controls [11,12]. Therefore, in order to characterize the median values of adinopectin large numbers of samples will be required. Considering an estimated standard deviation based on the reported values of 6.0 mg/L, with a significant level of 5%, for a power of 80%, a clinical difference between patients and controls of three units will require a sample size of 64 for both controls and patients. However, at the end of the first year, the results will permit an evaluation of the range of adiponectin levels in patients and controls and, therefore, may allow to recalculate the sample size for the following years.
2.4. Variables to be Determined
The variables determined in this study are described in the next sections. The schedule for collecting them is defined in Table 2.
2.5. Clinical Characteristics
The clinical characteristics that are being registered are: arterial hypertension, diabetes, dyslipidaemia, smoking habits, coronary artery disease, heart failure, cerebrovascular disease, and medication. They are considered according to the literature definition [13–19].
2.6. Anthropometric Measurements and Hemodynamic Lab Measurements
The anthropometric measurements and hemodynamic lab measurements are being collected in the morning, after an over-night fasting of at least 8 h. No intake of caffeinated beverages or tobacco use are allowed for 2 h before the determinations. The measurements are taken after 5 min of rest in a comfortable room, with the patients dressed in light clothing. The height, weight, body mass index, waist circumference, hip circumference, waist-to-hip ratio and skinfold thickness are measured according to standard protocol [19–22].
The hemodynamic parameters ankle-brachial index, blood pressure, cfPWV, CBP are determined according to the recommendations [1,8,13,23]. The ankle-brachial index is measured with a handheld Doppler (LifeDop® 150 with 8 MHz Probe) and an Aneroid Sphygmomanometer manual blood pressure. The ankle-brachial index is calculated for each leg as the ratio of the higher systolic pressure in the ankle by the higher systolic pressure in the arm. cfPWV is to be determined using the Sphygmocor® device (Atcor Medical Pty Ltd, West Ryde, NSW, Austria) with the participant in supine position. Measured cfPWV will be compared with the standardized method. CBP is recorded with the patient in supine position using the Sphygmocor® device at the carotid artery. The carotid pressure waveforms are recorded with applanation tonometry and then scaled to the brachial mean and diastolic pressure.
2.7. Carotid Arteries Characterization
The carotids are characterized using a SIEMENS (Siemens Medical Solutions, Inc., Mountain View, CA, USA) ultrasound ACUSON X300 with a linear scan head 5–10 Hz. Two-dimensional grey scale is used to measure the Intima-media Thickness (IMT), the Extra-media Thickness (EMT), the presence and morphology of atherosclerotic plaque [24].
To determine the IMT, the probe surface is placed to the common carotid artery, in longitudinal position [24]. Two bright lines are identified: the interface between blood and the intima and the layer between intima and media [24]. The distance between these two lines is the IMT [24]. The IMT is measured according to the Mannheim Consensus guidelines on a 10-mm length segment starting 5 mm proximally to the carotid bulb. Three measurements are taken in each common carotid artery [24].
To calculate the EMT, the carotid artery and jugular vein are both scanned with the probe in a perpendicular position to the vessels. The distance between the carotid media-adventitia interface and jugular lumen are determined along 7 mm segment, starting 3 mm proximal to the bulb [25]. Five values are recorded at the end-diastole from five consecutive beats. The mean of these values is the EMT [25].
The number of atherosclerotic plaques at the carotid bifurcation is recorded. The morphology and the area of the biggest plaque and the quantity of plaques is also described. The plaque surface is classified as smooth, irregular, or ulcerated. A depression of the plaque surface by more than 2 mm indicates ulceration [24]. The plaque area is calculated based on the length and height of the plaque [24]. The plaque echogenicity is classified according to the Gray-Weale’s classification modified by Geroulakos et al. [26]. Colour and pulse Doppler ultrasonography is applied to detect the grade of carotid artery stenosis [24]. The grade of stenosis is defined according to the Guidelines of the European Society of Vascular Surgery [27].
2.8. Adipose Tissue and Skeletal Muscle Quantification
A transverse CT image obtained at lower border the third lumbar vertebra (in the lower border) is used to quantify the SM and AT (visceral, subcutaneous and periaortic) [28].
The SM area is calculated adding the areas of the following muscle at the third lumbar vertebra: psoas, erector spinae, quadratus lumborum, transversus abdominis, external and internal oblique abdominal muscle and rectus abdominis [28].
The area of subcutaneous compartment is determined as the area of tissue between the abdominal muscles and the body contour (Figure 1) [29]. Visceral fat area is the area of the tissue within the contour of the visceral cavity [29].
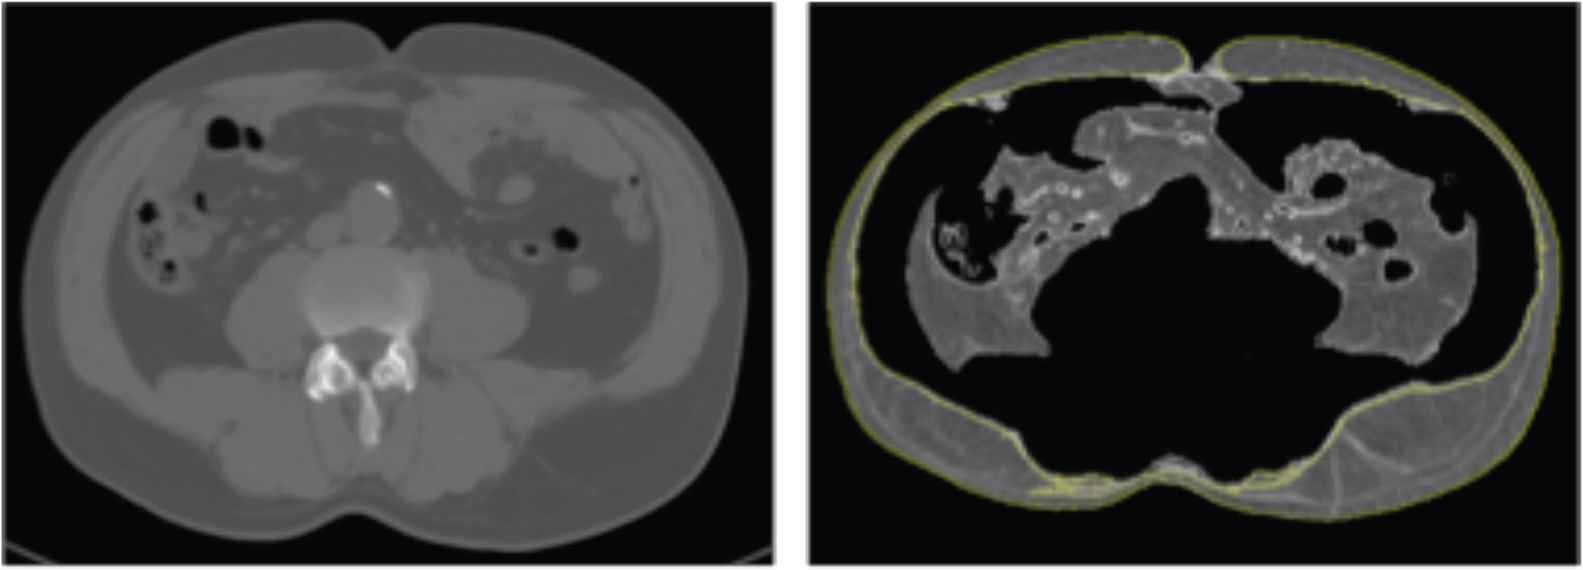
Quantification of subcutaneous fat. The quantity of subcutaneous fat is the area of tissue superficial to the abdominal wall. In this figure the subcutaneous adipose tissue is marked by the yellow line.
Periaortic fat area is determined as the fat around the aorta (Figure 2) [30]. Images are obtained for all subjects using a 128 slices CT scanner (Siemens Somatom Perspective 128, Siemens Medical Solutions, Forchheim, Germany) after calibration with a phantom (CATPHAN® water phantom, The Phantom Laboratory, NY, USA). CT scan is performed at the level L3–L4. Routine calibration is completed before quantitative computed tomography measurement. The scan parameters are as follows: 130 kV, 200 mAs, 45 cm field of view (FoV), 190 mm bed height, 5 mm slice thickness, and 512 × 512 matrix, 64 × 0.6 mm2 detector collimation and a pitch of 0.6. All subjects are scanned in the supine position with both arms stretched above the head in inspiratory apnoea.
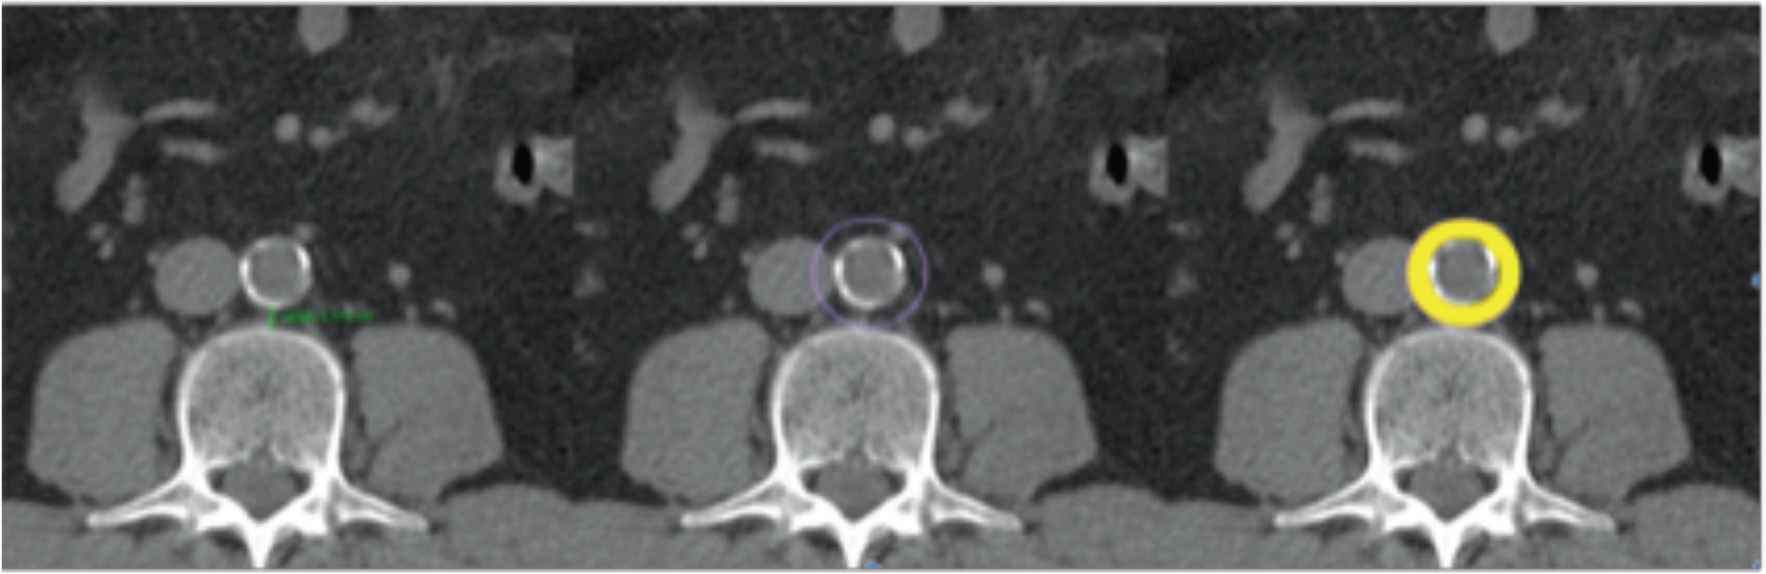
Quantification of periaortic adipose tissue. Determination of the perivascular adipose tissue in the CT scan. The periaortic adipose tissue is marked in yellow.
2.9. Skeletal Muscle Strength Measurement
The SM strength is being determined with a Jamar® hydraulic hand dynamometer (PATTERSON MEDICAL, Warrenville, IL, USA). The participants are seated with the shoulder adducted and neutrally rotated, the elbow flexed at 90° and forearm and wrist in neutral position [16]. The dynamometer is set to the second handle position from the inside. The hold is around the readout dial to prevent inadvertent dropping. The patient performs one try-out attempt. Then he is motivated to squeeze as hard as possible. The strength of both hands are determined. The scores of the three successive trials for each hand are recorded. The average score of the three trials are calculated.
2.10. Blood Samples
The following data is being analysed: haemoglobin, haematocrit, platelets; leucogram, ionogram, creatinine, urea, glucose, glycosylated haemoglobin A1c, total cholesterol, high-density lipoprotein-cholesterol, triglycerides, low-density lipoprotein, C-reactive protein, fibrinogen, d-dimer, albumin, uric acid and total proteins.
In order to determine the serum levels of adipokines and myokines, the blood is centrifuged immediately after collection at 2000 g for 15 min. Serum is stored at −80°C for later batch assessment of ghrelin, leptin, resistin, visfatin, Interleukin (IL)-8, IL-15, IL-6, irisin, myostatin, myonectin and decorin.
2.11. Samples of Adipose and Skeletal Tissue
At the time of surgery, samples from AT (subcutaneous, visceral and perivascular) SM, artery and atherosclerotic plaque are being collected for histological, myokines and adipokines determination.
2.12. Determination of Serum and Tissue Levels of Adipokines and Myokines
The serum and tissue levels of ghrelin, leptin, resistin, visfatin will be assessed by using the Bio-Plex Human Diabetes 4-plex Assay #YB 000000NT (BioRad, CA, USA). The adiponectin and adipsin concentrations will be determined with the Bio-Plex Human Diabetes adipsin and adiponectin Assays #171A7002M (BioRad). The intra- and inter-assay coefficients of variations are for ghrelin 4% and 2%, for leptin 3% and 4%, for resistin 3% and 4%, for visfatin 4% and 3%, for adiponectin 4% and 2% and for adipsin 6% and 4%. The sensitivity (pg/mL) for ghrelin determination is 2.20, for leptin is 3.10, for resistin is 0.30, for visfatin is 137, for adiponectin is 51 and for adipsin is 29.
IL-8, IL-15 and IL-6 will be determined with the Bio-Plex Pro Human Cytokine IL-8 Set #171B5008M, Bio-Plex Pro Human Cytokine IL-15 Set #171B5013M and Bio-Plex Pro Human Cytokine IL-6 Set # 171BK29MR2. The intra- and inter-assay coefficients of variations are for IL-8 9% and 4%, for IL-15 5% and 6% and for IL-6 7% and 11%. The sensitivity (pg/ml) for IL-8, IL-15 and IL-6 determination is 1.0, 2.4 and 2.6, respectively.
Irisin and myostatin are quantified by enzyme-linked immunosorbent assay (ELISA) using the Human Irisin/FNDC5 Duo Set ELISA DY9420-05 (R&D SYSTEMS®) Assay range: 250.00–8.00 pg/mL and the GDF-8/Myostatin Quantikine ELISA- DGDF80 (R&D SYSTEMS®, Minneapolis, USA) Assay range: 31.3–2.00 pg/mL and sensitivity 5.32 pg/mL.
Myonectin will be determined using the human CTRP5/C1qTNF 5 Alexa Fluor 594 Antibody (Clone 332923) – IC3167T (R&D SYSTEMS®).
Decorin will be determined using the human Decorin DuoSET ELISA-DY143 (R&D SYSTEMS®) Assay range: 31.20–2.00 pg/mL.
2.13. Histology of Adipose Tissue, Skeletal Muscle and Artery
The samples of AT, SM, artery and atherosclerotic plaque are being embedded in paraffin and stained with haematoxylin/eosin.
The following data about AT will be collected: dimension of adipocytes (determined as sectional area and cell perimeter); number and type of adipocytes (white, brown, beige); number and type of macrophages (M1 or M2); type and number of other inflammatory cells present (neutrophils, macrophages, mast cells and T-cells, lymphocytes T, lymphocytes B, NK cells, eosinophils, mastocytes, pre-adipocytes); position of the macrophages in relation to other inflammatory cells; total collagen density (fibrosis) and capillary vascularization.
In the SM the following parameter will be analysed: myofiber number, size, shape and area (Type I and II); the infiltration of non-contractile material, such as AT and connective tissue; ratio of capillaries to cross-sectional fibber area and the presence of inflammatory cells (type, number).
In the artery histology the following information will be recorded: the thickness of different layers, collagen/elastin content and structure, number and location of inflammatory cells and vascular smooth muscle cells.
The atherosclerotic plaque will be classified according to gold-standard histological classifications: (1) American Heart Association classification and (2) semi-quantitative scale by Lovett et al. [31].
The plaques will be defined as: definitely stable, probably stable, probably unstable and definitely unstable [11]. In the plaques, the following data will be registered: presence/absence of intraplaque haemorrhage, thrombus, foam cells, lipid core size, proportion of fibrous tissue, neovascularization, calcification, cap rupture, overall inflammation, and infiltration of the fibrous cap with inflammatory cells (inflammation grade according to the number of macrophages and lymphocytes present) [31].
3. RESULTS
We analyzed the data collected from December 2018 to August 2019. In this period, 47 PAD were studied: 33 with IC (28 male; age: 67.24 ± 9.97 years) and 14 CLI (seven male; age: 69.21 ± 8.33 years). The demographic and clinical characteristic of the patients are described in Table 3. The groups differ in the prevalence of smoking habits, diabetes and HbA1C value. There was a higher number of smokers in the IC group, while the CLI patients had a higher prevalence of non-controlled diabetes. Analyzing the anthropometric measures, there is no statistic meaningful differences between the two groups, except for suprailiac skinfold (IC: 9.74; CLI: 12.3 mm). We found that the CLI patients have higher quantity of visceral and subcutaneous AT and a lower quantity of SM determined on the CT scan, but these differences were not statistically significant (subcutaneous AT area: 15208 ± 7600.00 mm2 IC vs. 17929 ± 10187.33 mm2 CLI; visceral AT area: 18944 ± 10096.30 mm2 IC vs. 19056 ± 10189.04 mm2 CLI; SM area: 15403 ± 15459.33 mm2 IC vs. 14872 ± 52538.78 mm2 CLI). In terms of the SM analysis, we noted that the CLI had lower skeletal muscle strength in both hands and lower SM density and these differences were statistically significant [muscle strength right hand: 22.89 ± 8.20 kgf IC vs. 17.32 ± 7.84 kgf CLI, p < 0.05; skeletal muscle strength left hand: 22.7 ± 8.98 kgf IC vs. 16.59 ± 8.35 kgf CLI, p = 0.04; SM density: 20.34 ± 11.73 Hounsfield Units (HU) IC vs. 9.3 ± 28.47 HU CLI, p < 0.05] (Figures 3 and 4).
| IC (n = 33) | CLI (n = 14) | p | |
|---|---|---|---|
| Age (years) | 67.24 ± 9.97 | 69.21 ± 8.33 | 0.525 |
| Gender (male), n (%) | 78.79 (28) | 50 (7) | 0.080 |
| Hypertension, n (%) | 84.85 (28) | 85.71 (12) | 1.00 |
| Active smoking, n (%) | 51.51 (17) | 7.14 (1) | 0.04* |
| Smoking pack (years) | 49.30 ± 25.51 | 36.25 ± 11.09 | 0.33 |
| Diabetes mellitus, n (%) | 36.36 (12) | 85.71 (12) | 0.02* |
| Coronary artery disease, n (%) | 21.21 (7) | 7.14 (1) | 0.40 |
| Cerebrovascular disease, n (%) | 12.12 (4) | 0 (0) | 0.30 |
| Carotid stenosis >50, n (%) | 21.21 (7) | 7.14 (1) | 0.54 |
| Antiplatelet therapy, n (%) | 87.88 (29) | 64.29 (9) | 0.74 |
| Statins, n (%) | 90.90 (30) | 92.86 (13) | 0.66 |
| ACEi, n (%) | 41.42 (14) | 42.86 (6) | 0.08 |
| HbA1C (%) | 6.37 ± 1.16 | 8.41 ± 1.72 | 0.007* |
| Total cholesterol (mg/dL) (mean ± SD) | 165.67 ± 36.20 | 143.83 ± 49.46 | 0.12 |
| HDL-cholesterol (mg/dL) (mean ± SD) | 53.45 ± 13.53 | 45.50 ± 12.95 | 0.09 |
| LDL-cholesterol (mg/dL) | 86.45 ± 29.07 | 73.58 ± 42.86 | 0.27 |
| Triglycerides (mg/dL) | 123.62 ± 63.78 | 134.67 ± 54.08 | 0.45 |
| C-reactive protein (mg/L) | 4.55 ± 2.60 | 23.23 ± 29.54 | 0.16 |
p < 0.05 is considered statistically significant. Student’s t-test or Chi-square test were performed to determine differences between groups.
ACEi, angiotensin-converting enzyme inhibitors; HDL, high-density lipoprotein; LDL, low-density lipoprotein.
Demographic and clinical characteristics of the CLI and IC patients
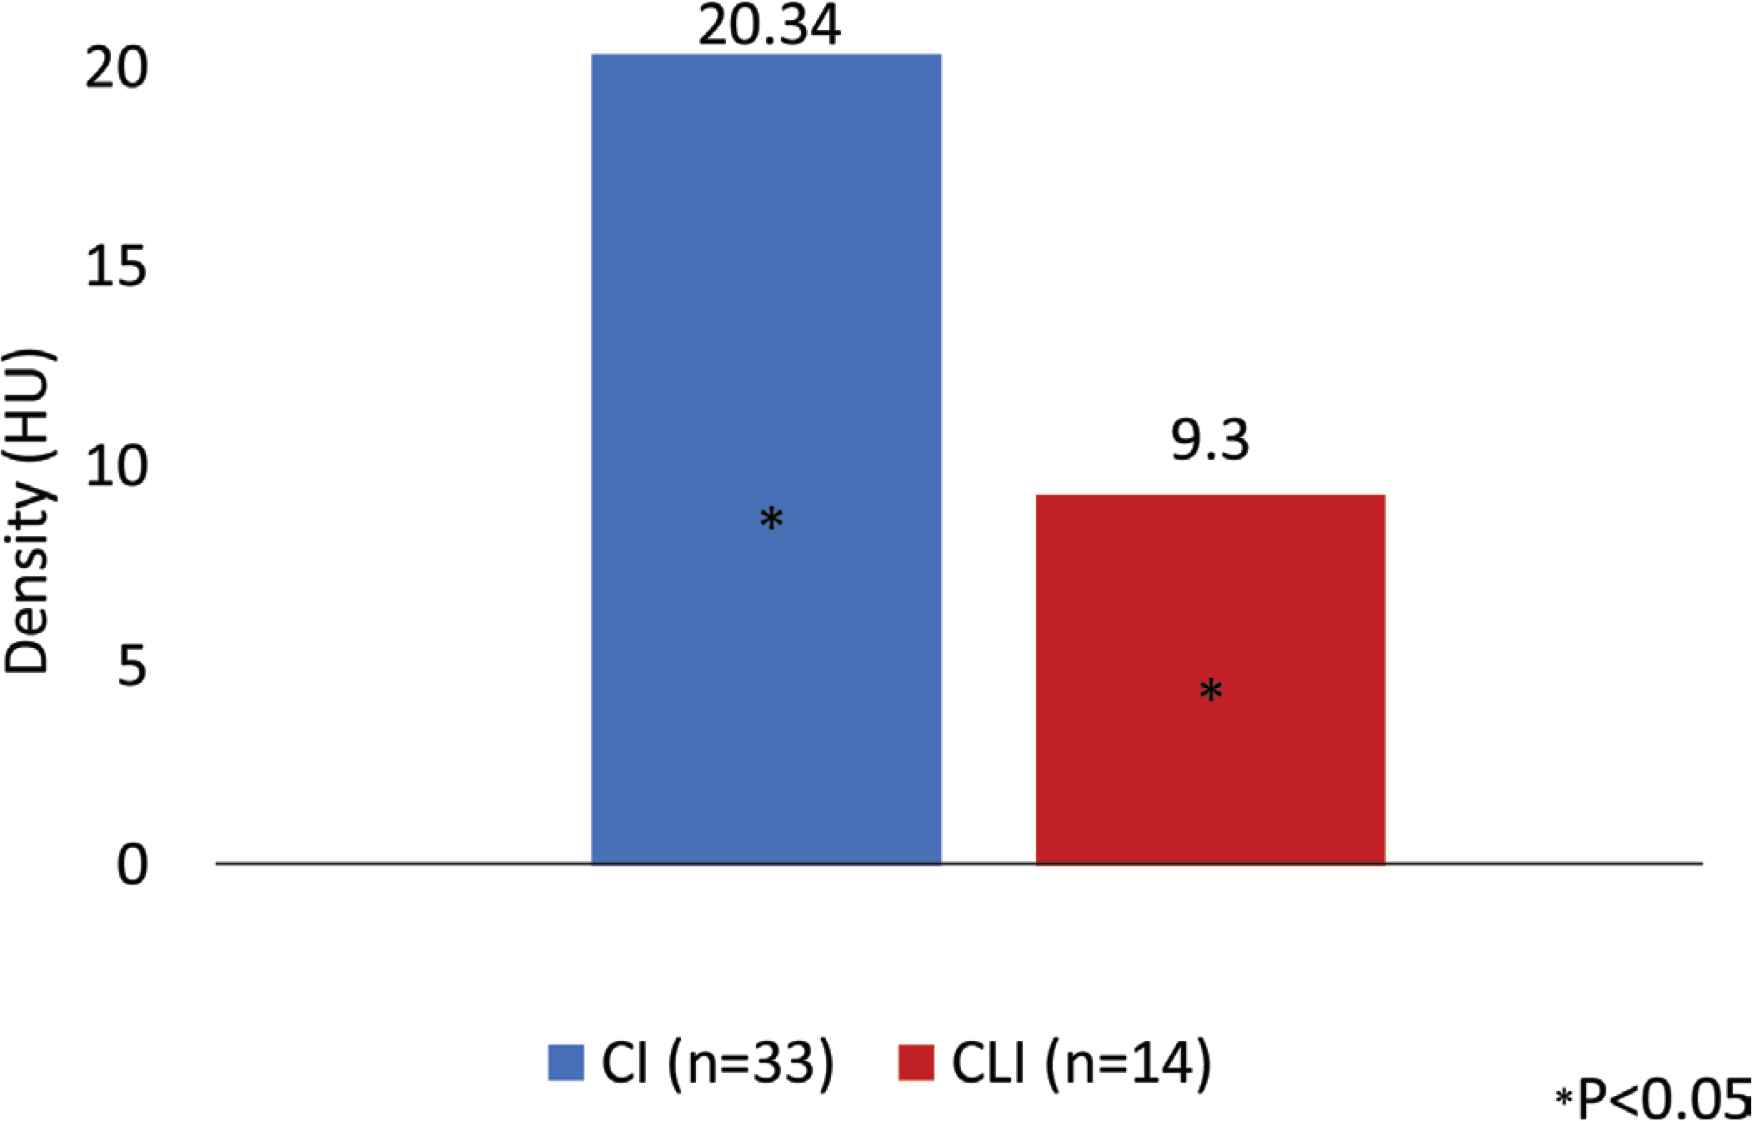
Skeletal muscle density in two group of patients studied. Patients with Critical Limb Ischemia (CLI) had lower skeletal muscle density when compared with patient with Intermittent Claudication (IC). Hounsfield Units (HU) is a radiological scale describing the density of tissues on CT scans.
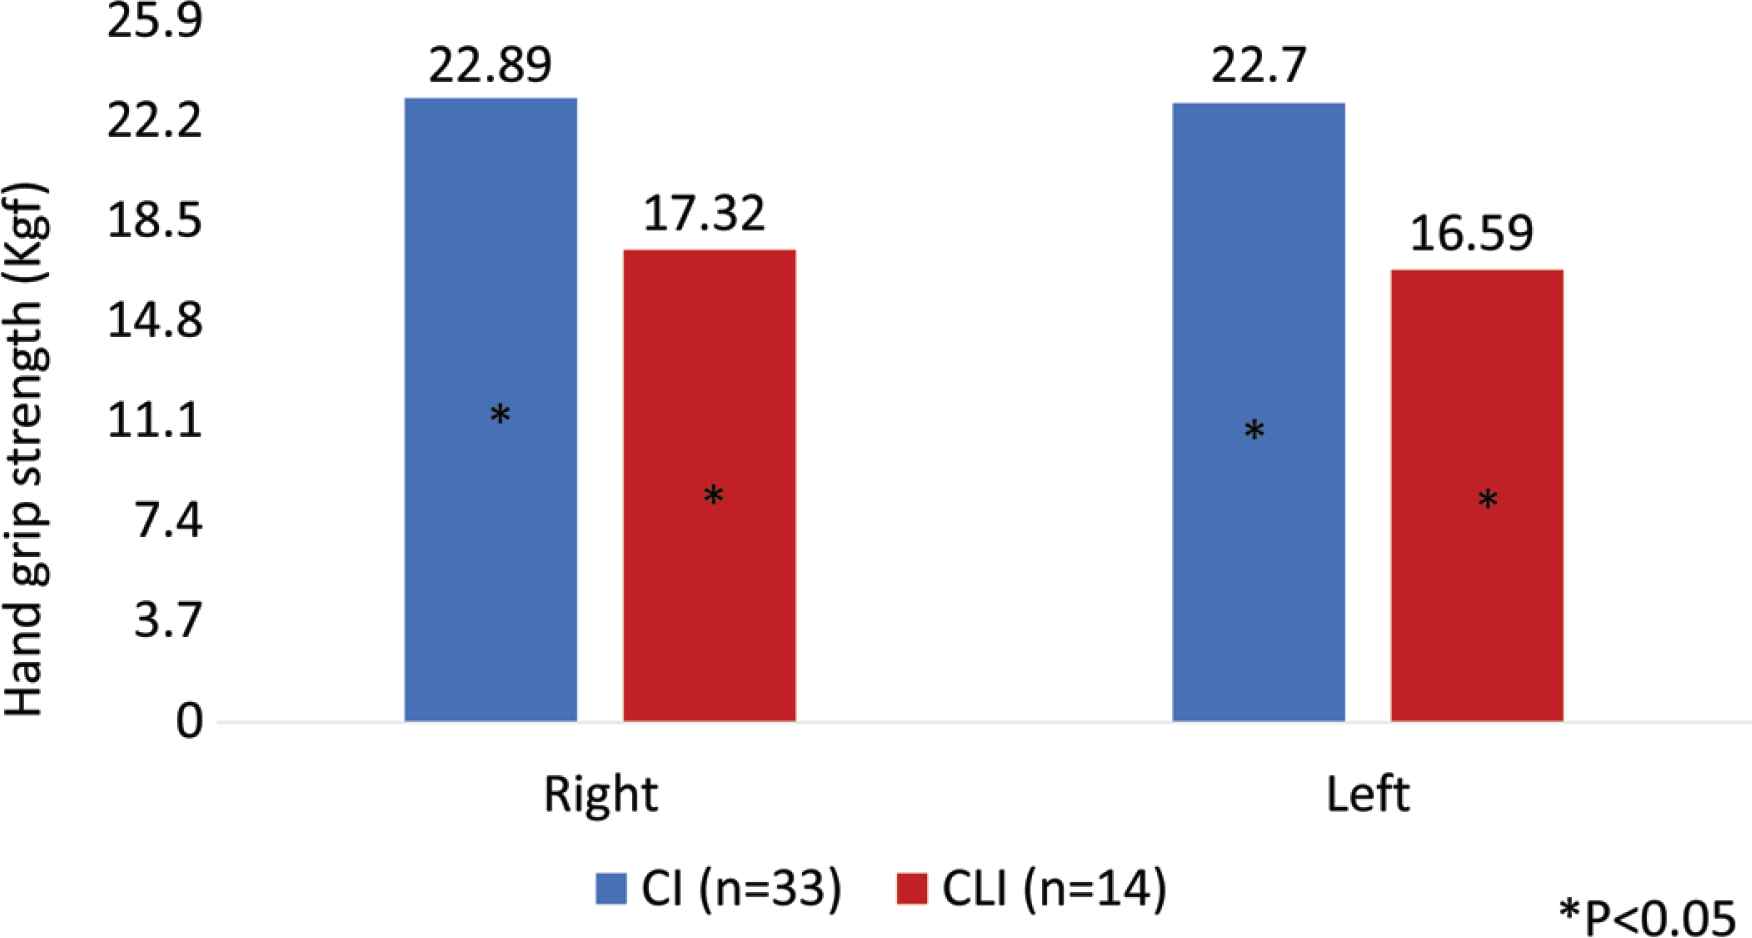
Hand grip strength in patients with Critical Limb Ischemia (CLI) and patients with Intermittent Claudication (IC). Patients with CLI had lower right and left hand grip strength (expressed in kgf) when compared with patient with IC. This difference is statistically significant.
4. DISCUSSION
The objective of this paper is to describe a project that aims to uncover new details of the role of AT and SM in PAD/CAD and arteriosclerosis. The preliminary data of this research project seems to suggest that CLI patients have SM dysfunction, with loss of muscle strength and density. The loss of muscle strength (measured from hand grip) is associated, according to the literature with arterial stiffness, inflammation, endothelial dysfunction and all-cause mortality including cardiovascular mortality [12,32,33]. Muscle strength has been shown to be more relevant than muscle quantity [32]. A cross-sectional study of cohort of 208 individuals, of ages of 80 years old and older, demonstrated that reduction of muscle mass and strength were associated with atherosclerosis and endothelial dysfunction [16].
This is the first study suggesting that CLI patients could have lower SM density and strength. This result would be consolidated with the conclusion of the research project and better understood after histological and myokines/adipokines analysis.
The endocrine function of SM, inferred from one of its myokines (irisin) is being investigated in CAD and PAD. Lee et al. [34] concluded that irisin is independently associated with CAD, analysing 102 dialysis patients (65 without and 37 with carotid artery stenosis). El-Lebedy et al. [35] compared irisin levels in three groups: control, diabetics, diabetics + cardiovascular disease, including PAD, CAD and ischemic heart disease. Irisin was lower in diabetics with cardiovascular disease when compared with the other groups [35].
The role of AT in PAD and CAD is also controversial. Some studies tried to correlate the anthropometric measures with PAD. In the REduction of Atherothrombosis for Continued Health (REACH) registry, the prevalence of obesity was only slightly lower in PAD patients, than in coronary disease patients, probably due to the higher prevalence of smokers in this population [36]. The markers of visceral adiposity, have been associated with the severity and prognosis of lower limb atherosclerosis [37]. Our preliminary data suggest that CLI have higher visceral and subcutaneous AT.
Other research projects have determined the serum and tissue levels of adipokines in patients with PAD and CAD, some of them with apparent contradictory results: Čejková et al. [38] have determined the gene expression of tumor necrosis factor (TNF), monocyte chemoattractant protein-1 and IL-6 in subcutaneous, visceral and PVAT in 24 PAD patients and compared it with 35 living kidney donors. The authors described that the expression of these genes was significant higher in visceral AT of PAD, compared with controls [38]. The degree of arterial stenosis on CT scans and gene expression were not significantly associated [38]. Gasbarrino et al. [39] measured the quantity of adiponectin in the carotid plaques of 143 patients submitted to endarterectomy. The authors related the expression of adiponectin with atherosclerotic plaque histology and with its expression in the PVAT [39]. Dieplinger et al. [11] determined the serum level of adiponectin in 433 patients with symptomatic PAD and compared it with 433 controls. A lower level of adiponectin in PAD patients was found, when comparing with controls [40]. Bountouris [41] determined the serum level of leptin in 74 patients who underwent carotid endarterectomy. The author concluded that this biomarker was associated with symptomatic carotid artery stenosis [41]. Musialek et al. [42] concluded that the serum level of leptin was not different between symptomatic and asymptomatic carotid patients.
5. CONCLUSION
Due to the increasing numbers of obese and paradoxically sarcopenic patients, it is essential to conduct research studies, in order to understand the impact of these body composition changes in arteriosclerosis and different stages of atherosclerosis. The novelty of this project is its large and consistent sample, with broad an extensive study of both inflammatory markers, histology features and endocrine markers of AT and SM and the attempt to find an association with artery function, arteriosclerosis and atherosclerosis.
CONFLICTS OF INTEREST
The authors declare they have no conflicts of interest.
AUTHORS’ CONTRIBUTION
JF made the literature search; designed the study; wrote the investigation protocol; collected and analyzed the data; wrote the manuscript; PC helped and corrected the study design and the protocol; supervised the project; helped in the data analysis; corrected the manuscript. AM helped and corrected the study design and the protocol; supervised the project; helped in the data analysis; corrected the manuscript. CC collected the data; corrected the manuscript. CS collected the data; corrected the manuscript. IV collected the data; corrected the manuscript. AC helped in the protocol design; collected the data; helped in data analysis, corrected the manuscript and made the final revision of the manuscript. A. Mesquita supervised the project and made the final revision of the manuscript. JC supervised the project and made the final revision of the manuscript.
FUNDING
This work was supported by a scholarship granted by
ACKNOWLEDGMENTS
Radiology Technician from Hospital da Senhora da Oliveira, Guimarães for the contribution in the elaboration of CT scan protocol; Anatomopathological Department from Hospital da Senhora da Oliveira, Guimarães for helping in the determination of the variables to be determined in the histological samples.
Footnotes
Peer review under responsibility of the Association for Research into Arterial Structure and Physiology
Data availability statement: The data that support the findings of this study are openly available in https://www.synapse.org/TAMstudy.
REFERENCES
Cite this article
TY  - JOUR
AU  - Joana Ferreira
AU  - Pedro Cunha
AU  - Armando Mansilha
AU  - Cristina Cunha
AU  - Cristina Silva
AU  - Isabel Vila
AU  - Alexandre Carneiro
AU  - Amílcar Mesquita
AU  - Jorge Cotter
PY  - 2020
DA  - 2020/05/15
TI  - Role of Adipose Tissue and Skeletal Muscle in Atherosclerosis and in Central Hemodynamics
JO  - Artery Research
SP  - 76
EP  - 83
VL  - 26
IS  - 2
SN  - 1876-4401
UR  - https://doi.org/10.2991/artres.k.200511.001
DO  - 10.2991/artres.k.200511.001
ID  - Ferreira2020
ER  -