
Association between Rutherford Classification and CHA2DS2-VASc, CHADS2 and ASCVD Scores in Peripheral Artery Disease Patients
- DOI
- 10.2991/artres.k.200504.001How to use a DOI?
- Keywords
- Peripheral artery disease; Rutherford classification; CHADS2; CHA2DS2-VASc; ASCVD
- Abstract
Background and Aim: The classification system is important in assessing the severity of Peripheral Artery Disease (PAD) and making the treatment decision. However, classification systems may not be sufficient and scoring systems developed to predict cardiovascular and cerebrovascular events can also be useful to assess the severity of PAD. In this study, our aim was to investigate the association of the Rutherford classification and CHADS2, CHA2DS2-VASc and ASCVD scores in PAD patients.
Method: A total of 65 consecutive patients with PAD (males 92.3%, mean age 63.0 ± 9.2 years), who underwent percutaneous peripheral intervention were included in our retrospective study.
Results: There were 16 patients in Category 2, 31 patients in Category 3, and 10 patients in Category 4 and eight patients in Category 5. The CHADS2, CHA2DS2-VASc and ASCVD scores were found to be significantly different among the Rutherford categories and between each other. From Category 1 to 5, CHADS2, CHA2DS2-VASc and ASCVD scores were significantly increased. When we grouped the scores as CHADS2 <2 and ≥2 and CHA2DS2-VASc <4 and ≥4, it was determined that as the category increased the score group also increased. There was significantly correlation between CHADS2, CHA2DS2-VASc and ASCVD scores with the Rutherford categories in correlation analyses.
Conclusion: As far as we know, in this study which is the first study about the association of Rutherford classification and scoring systems, the major finding of the present study is that the CHADS2, CHA2DS2-VASc and ASCVD scores was independently correlated with the severity of Rutherford Category in patients with PAD.
- Copyright
- © 2020 Association for Research into Arterial Structure and Physiology. Publishing services by Atlantis Press International B.V.
- Open Access
- This is an open access article distributed under the CC BY-NC 4.0 license (http://creativecommons.org/licenses/by-nc/4.0/).
1. INTRODUCTION
Peripheral Artery Disease (PAD) secondary to atherosclerotic disease is currently the leading cause of morbidity and mortality in developed and developing countries. The frequency of PAD also increases with the increase of age. Risk factors for PAD are age, cigarette smoking, diabetes mellitus, hypertension, hyperlipidemia, Chronic Kidney Disease, obesity, and race similar to Coronary Artery Disease (CAD) and stroke [1,2]. The presentations of PAD are different, and these are; asymptomatic, intermittent claudication, Critical Limb Ischemia (CLI) or Acute Limb Ischemia (ALI). To date, many anatomical, clinical, or imaging-based classification systems have been used for PAD. Effective grading of patients provides physicians with objective criteria for patient assessment, treatment and clinical follow-up. Classification systems are also important in determining medical, surgical and percutaneous treatment preferences [3].
Although the CHADS2 scoring system was first used, after than the CHA2DS2-VASc scoring system which became standard, has been proven effective for assessing the prognostic risk of thromboembolism in nonvalvular Atrial Fibrillation (AF) patients [4]. Some scoring systems have been developed to evaluate and treat the risk of atherosclerotic Cardiovascular (CV) disease in adults without known cardiovascular disease. One of them is the atherosclerotic cardiovascular disease (×) Risk Estimator, which has been used frequently in recent years and is recommended by the American College of Cardiology and the American Heart Association [5].
These scoring systems and cardiovascular and cerebrovascular diseases have similar risk factors and may be useful even to assess the severity of atherosclerotic diseases. There is little and improper data on the relationship between PAD and risk scores. Rutherford classification is used to identify the severity of the clinical symptoms with objective findings in PAD. In this study, our aim was to investigate the association of the Rutherford classification and CHADS2, CHA2DS2-VASc and ASCVD scores in PAD patients.
2. MATERIALS AND METHODS
A total of 65 consecutive patients with PAD (males 92.3%, mean age 63.0 ± 9.2 years), who underwent percutaneous peripheral intervention were included in our retrospective study. Detailed medical history [age, gender, Diabetes Mellitus (DM), Hypertension (HT), Hyperlipidemia (HL), current cigarette smoking, family history of premature CAD, chronic heart failure, previous ischemic stroke or TIA, and PAD] and physical, standard 12-lead electrocardiographic, and echocardiographic examinations were performed, and the Rutherford classification were obtained for each patient according to the current literature (Table 1) [6]. Thereafter, all the scores (CHADS2, CHA2DS2-VASc and ASCVD) were calculated. Blood samples for fasting blood glucose, Total Cholesterol (TC), Low-density Lipoprotein Cholesterol (LDL-C), High-density Lipoprotein Cholesterol (HDL-C), Triglycerides (TG), and complete blood count were performed using standard laboratory methods. Type 2 DM was defined as a previous diagnosis and/or fasting blood glucose ≥126 mg/dl or the use of antidiabetic medications. HT was defined as repeated measurements of systolic blood pressure ≥140 mm Hg and/or diastolic ≥90 mm Hg, or chronic treatment with antihypertensive medications. HL was considered to be LDL-C above the target level according to the National Cholesterol Education Program-3 recommendations or the use of lipid-lowering medications. Cigarette smoking was defined as smoking ≥10 cigarettes a day for at least 1 year without a quit attempt. Transthoracic echocardiography was performed for each patient before intervention (Vivid 7 GE Medical System; GE Healthcare, Horten, Norway). Left Ventricular Ejection Fraction (LVEF) was measured using Simpson’s method.
| Grade | Category | Clinical description |
|---|---|---|
| 0 | 0 | Asymptomatic—no hemodynamically significant occlusive disease |
| I | 1 | Mild claudication |
| 2 | Moderate claudication | |
| 3 | Severe claudication | |
| II | 4 | Ischemic rest pain |
| III | 5 | Minor tissue loss—non-healing ulcer, focal gangrene with diffuse pedal ischemia |
| 6 | Major tissue loss—extending above TM level, functional foot no longer salvageable |
Rutherford classification for chronic limb ischemia
The CHADS2 score was the total of one point each for Heart Failure (HF), HT, age ≥ 75 years, and DM and two points for prior stroke or TIA. The CHA2DS2-VASc score was the total of one point each for HF, HT, age 65–74 years, DM, vascular disease, and female gender and two points each for prior stroke or TIA and age ≥ 75 years. ASCVD score was calculated by using calculation tool of guideline (http://tools.acc.org/ASCVD-Risk-Estimator-Plus/#!/calculate/estimate/). The study was approved by the local ethics committee and individual informed consent was obtained from all subjects.
2.1. Statistical Analysis
All analyses were performed using SPSS for Windows (version 22.0, SPSS, Chicago, IL, USA). Data are expressed as percentages or mean ± standard deviation. Continuous variables were analyzed for normal distribution using the Kolmogorov–Smirnov test. Categorical and continuous variables between groups were compared by independent Chi-square test and samples t-test, respectively. Categorical variables were presented as frequencies and percentages and compared using Pearson’s and Fisher’s Exact Test the Chi-square test. One-way repeated measures ANOVA was used for normally distributed continuous variables. A p-value <0.05 was considered as significant.
3. RESULTS
Demographic and laboratory characteristics of patients were categorized by Rutherford Categories (1–5). There were 16 patients in Category 2 (100% men, with a mean age of 62.7 ± 7.9 years), 31 patients in Category 3 (96.8% men, with a mean age of 59.6 ± 8.9 years), and 10 patients in Category 4 (90.0% men, with a mean age of 71.8 ± 8.6 years) and eight patients in Category 5 (62.5% men, with a mean age of 64.8 ± 5.4 years). Table 2 shows the comparison of clinical characteristics between Rutherford classifications. Category 4 was older, Category 3 was younger and Category 5 has less male gender, and there was a significant difference between age and gender groups (p = 0.004 and 0.006, respectively). While most of the patients in the categories presented with intermittent claudication symptoms, half of the patients in Category 5 consulted with rest pain. As the category stage increased, walking distance decreased significantly without intermittent claudication. DM and previous Percutaneous Coronary Intervention (PCI) were significantly different between the categories (p = 0.007 and 0.035, respectively). In the majority of patients in all categories, the target vessels are iliac arteries and femoral arteries. Patients in the high category groups had significantly higher serum glucose, TC and LDL-C levels and HDL-C and TG levels were significantly lower compared with the other groups.
| Parameters | All patients (n = 65) | Rutherford Category 2 (n = 16) | Rutherford Category 3 (n = 31) | Rutherford Category 4 (n = 10) | Rutherford Category 5 (n = 8) | p-value |
|---|---|---|---|---|---|---|
| Age (years) | 63.0 ± 9.2 | 62.7 ± 7.9 | 59.6 ± 8.9 | 71.8 ± 8.6 | 64.8 ± 5.4 | 0.004 |
| Male, n (%) | 60 (92.3) | 16 (100.0) | 30 (96.8) | 9 (90.0) | 5 (62.5) | 0.006 |
| Symptom, n (%) | <0.001 | |||||
| Intermittent claudication | 53 (81.5) | 14 (87.5) | 31 (100.0) | 6 (60.0) | 2 (25.0) | |
| Rest pain | 7 (10.7) | 2 (12.6) | – | 1 (10.0) | 4 (50.0) | |
| Trophic changes | 5 (7.8) | – | – | 3 (30.0) | 2 (25.0) | |
| Walking distance without claudication (mt) | 74.0 ± 58.0 | 103.8 ± 51.8 | 79.3 ± 60.7 | 42.2 ± 38.2 | 26.0 ± 21.9 | 0.003 |
| HT, n (%) | 55 (84.6) | 13 (81.3) | 24 (77.4) | 10 (100.0) | 8 (100.0) | 0.200 |
| HL, n (%) | 46 (70.7) | 13 (81.3) | 18 (58.1) | 9 (90.0) | 6 (75.0) | 0.163 |
| Current smoker, n (%) | 33 (50.8) | 7 (43.8) | 18 (58.1) | 5 (50.0) | 3 (37.5) | 0.174 |
| DM, n (%) | 34 (53.3) | 8 (50.0) | 10 (32.2) | 8 (80.0) | 8 (100.0) | 0.007 |
| AF, n (%) | 4 (6.1) | 1 (6.3) | 1 (3.2) | – | 2 (25.0) | 0.110 |
| Previous PCI, n (%) | 27 (41.5) | 9 (56.3) | 12 (38.7) | 6 (60.0) | – | 0.035 |
| Previous CABG, n (%) | 14 (21.5) | 5 (31.3) | 7 (22.6) | 1 (10.0) | 1 (12.5) | 0.554 |
| Previous peripheral intervention, n (%) | 9 (13.8) | 3 (18.8) | 5 (16.1) | 1 (10.0) | – | 0.600 |
| Stenosis (%) | 94.0 ± 7.2 | 94.6 ± 7.1 | 93.8 ± 6.9 | 92.0 ± 9.1 | 98.3 ± 4.1 | 0.242 |
| CAD, n (%) | 0.227 | |||||
| Normal | 10 (15.4) | 1 (6.3) | 6 (19.3) | 2 (20.0) | 1 (12.5) | |
| 1 vessel disease | 22 (33.8) | 8 (50.0) | 7 (22.6) | 4 (40.0) | 3 (37.5) | |
| 2 vessel disease | 29 (44.6) | 7 (43.8) | 16 (51.6) | 4 (40.0) | 2 (25.0) | |
| 3 vessel disease | 4 (6.2) | – | 2 (6.5) | – | 2 (25.0) | |
| Target vessel, n (%) | 0.829 | |||||
| CIA | 24 (36.9) | 6 (37.5) | 10 (32.2) | 5 (50.0) | 3 (37.5) | |
| SFA | 33 (50.8) | 9 (56.4) | 16 (51.6) | 4 (40.0) | 4 (50.0) | |
| Popliteal | 5 (7.7) | 1 (6.3) | 2 (6.4) | 1 (10.0) | 1 (12.5) | |
| Below the knee | 3 (4.6) | – | 3 (9.7) | – | – | |
| CHA2DS2-VASc group, n (%) | 0.002 | |||||
| <4 | 38 (58.5) | 10 (62.5) | 24 (77.4) | 2 (20.0) | 2 (25.0) | |
| ≥4 | 27 (41.5) | 6 (37.5) | 7 (22.6) | 8 (80.0) | 6 (75.0) | |
| CHADS2 group, n (%) | 0.003 | |||||
| <2 | 38 (58.5) | 7 (43.8) | 20 (64.5) | 2 (20.0) | – | |
| ≥2 | 27 (41.5) | 9 (56.3) | 11 (35.5) | 8 (80.0) | 8 (100.0) | |
| ASCVD score | 22.9 ± 13.5 | 23.9 ± 15.5 | 17.0 ± 8.0 | 32.0 ± 14.7 | 30.4 ± 15.1 | 0.012 |
| CHA2DS2-VASc | 3.1 ± 1.1 | 3.0 ± 1.0 | 2.7 ± 1.0 | 4.1 ± 1.1 | 3.7 ± 0.6 | 0.001 |
| CHADS2 | 1.6 ± 0.9 | 1.5 ± 0.8 | 1.3 ± 0.8 | 2.6 ± 0.8 | 2.1 ± 0.2 | <0.001 |
| Echocardiographic parameters | ||||||
| LVEF (%) | 51.2 ± 13.9 | 48.3 ± 15.6 | 52.9 ± 13.4 | 44.0 ± 15.7 | 56.8 ± 8.8 | 0.222 |
| LVEDD (cm) | 4.8 ± 0.6 | 5.3 ± 0.9 | 4.7 ± 0.5 | 4.8 ± 0.4 | 4.6 ± 0.2 | 0.435 |
| LVESD (cm) | 3.2 ± 0.7 | 3.7 ± 1.1 | 3.0 ± 0.7 | 3.3 ± 0.7 | 2.9 ± 0.1 | 0.623 |
| LA (cm) | 3.9 ± 0.5 | 4.0 ± 0.4 | 3.9 ± 0.5 | 3.9 ± 0.6 | 3.4 ± 0.2 | 0.033 |
| sPAP (mm Hg) | 23.8 ± 15.3 | 24.5 ± 16.1 | 21.0 ± 13.6 | 30.0 ± 19.5 | 23.7 ± 10.3 | 0.470 |
| Laboratory parameters | ||||||
| Serum glucose (mg/dl) | 134.4 ± 70.0 | 139.7 ± 63.1 | 120.8 ± 68.3 | 115.3 ± 59.8 | 197.8 ± 76.2 | 0.019 |
| HbA1c (%) | 6.68 ± 1.66 | 6.54 ± 1.45 | 6.52 ± 2.04 | 6.32 ± 1.32 | 7.25 ± 0.82 | 0.080 |
| Serum creatinine (mg/dl) | 1.1 ± 0.9 | 1.2 ± 0.9 | 1.0 ± 0.3 | 1.1 ± 0.5 | 1.8 ± 1.1 | 0.208 |
| Total cholesterol (mg/dl) | 188.8 ± 41.9 | 185.9 ± 55.2 | 193.8 ± 35.7 | 149.4 ± 45.0 | 212.8 ± 35.9 | 0.004 |
| Triglyceride (mg/dl) | 192.7 ± 123.6 | 255.2 ± 201.8 | 188.9 ± 70.5 | 90.1 ± 19.4 | 193.5 ± 70.6 | 0.003 |
| LDL cholesterol (mg/dl) | 112.8 ± 33.3 | 105.6 ± 43.6 | 117.1 ± 28.5 | 85.2 ± 16.3 | 140.6 ± 24.6 | 0.002 |
| HDL cholesterol (mg/dl) | 39.9 ± 12.9 | 38.6 ± 9.5 | 40.7 ± 13.2 | 45.9 ± 17.0 | 33.0 ± 10.0 | 0.215 |
| Hemoglobin (g/dl) | 14.6 ± 2.1 | 14.1 ± 1.9 | 15.3 ± 1.6 | 13.7 ± 3.0 | 13.9 ± 2.2 | 0.346 |
| Platelet (×109/L), mean ± SD | 239.6 ± 61.8 | 229.5 ± 69.8 | 246.0 ± 46.0 | 215.3 ± 69.5 | 262.0 ± 74.2 | 0.261 |
CABG, coronary artery bypass grafting; LVEDD, left ventricular end diastolic diameter; LVESD, left ventricular end systolic diameter; LA, left atrium; sPAP, systolic pulmonary artery pressure; CIA, common iliac artery; SFA, superficial femoral artery.
Baseline characteristics of the patients
The CHADS2, CHA2DS2-VASc and ASCVD scores were found to be significantly different among the Rutherford categories and between each other. From Category 1 to 5, CHADS2, CHA2DS2-VASc and ASCVD scores were significantly increased. When we grouped the scores as CHADS2 <2 and ≥2 and CHA2DS2-VASc <4 and ≥4, it was determined that as the category increased the score group also increased. The CHADS2, CHA2DS2-VASc and ASCVD scores of patients according to Rutherford categories are listed in Tables 3 and 4. The CHADS2, CHA2DS2-VASc, and their groups correlated significantly with the Rutherford categories (Table 4). When we performed Rutherford staging instead of the category, the scores increased as the stage increased (Table 5). The association between the Rutherford Category and the CHADS2, CHA2DS2-VASc and ASCVD scores was shown in Figure 1.
| Parameters | Rutherford Category 2 (n = 16) | Rutherford Category 3 (n = 31) | Rutherford Category 4 (n = 10) | Rutherford Category 5 (n = 8) | p-value (2–3) | p-value (2–4) | p-value (2–5) | p-value (3–4) | p-value (3–5) | p-value (4–5) |
|---|---|---|---|---|---|---|---|---|---|---|
| CHA2DS2-VASc group, n (%) | 0.279 | 0.034 | 0.083 | 0.001 | 0.005 | 0.800 | ||||
| <4 | 10 (62.5) | 24 (77.4) | 2 (20.0) | 2 (25.0) | ||||||
| ≥4 | 6 (37.5) | 7 (22.6) | 8 (80.0) | 6 (75.0) | ||||||
| CHADS2 group, n (%) | 0.172 | 0.216 | 0.026 | 0.014 | 0.001 | 0.180 | ||||
| <2 | 7 (43.8) | 20 (64.5) | 2 (20.0) | – | ||||||
| ≥2 | 9 (56.3) | 11 (35.5) | 8 (80.0) | 8 (100.0) | ||||||
| ASCVD score | 23.9 ± 15.5 | 17.0 ± 8.0 | 32.0 ± 14.7 | 30.4 ± 15.1 | 0.049 | 0.202 | 0.345 | <0.001 | 0.001 | 0.821 |
| CHA2DS2-VASc | 3.0 ± 1.0 | 2.7 ± 1.0 | 4.1 ± 1.1 | 3.7 ± 0.6 | 0.250 | 0.025 | 0.097 | 0.001 | 0.010 | 0.414 |
| CHADS2 | 1.5 ± 0.8 | 1.3 ± 0.8 | 2.6 ± 0.8 | 2.1 ± 0.2 | 0.420 | 0.003 | 0.101 | <0.001 | 0.027 | 0.063 |
Rutherford Category and scores
| Parameters | r | p-value |
|---|---|---|
| CHA2DS2-VASc group | 0.308 | 0.012 |
| CHADS2 group | 0.270 | 0.030 |
| ASCVD score | 0.211 | 0.091 |
| CHA2DS2-VASc score | 0.300 | 0.015 |
| CHADS2 score | 0.325 | 0.008 |
| Severity of stenosis | 0.065 | 0.618 |
| Gender | −0.343 | 0.005 |
| DM | −0.299 | 0.015 |
| Walking distance without claudication | −0.500 | <0.001 |
Correlations of Rutherford Category and scores
| Parameters | Rutherford stage I (n = 47) | Rutherford stage II (n = 10) | Rutherford stage III (n = 8) | p-value |
|---|---|---|---|---|
| CHA2DS2-VASc group, n (%) | 0.001 | |||
| <4 | 34 (72.3) | 2 (20.0) | 2 (25.0) | |
| ≥4 | 13 (27.7) | 8 (80.0) | 6 (75.0) | |
| CHADS2 group, n (%) | 0.002 | |||
| <2 | 27 (57.4) | 2 (20.0) | – | |
| ≥2 | 20 (42.6) | 8 (80.0) | 8 (100.0) | |
| ASCVD score | 19.4 ± 11.5 | 32.0 ± 14.7 | 30.4 ± 15.1 | 0.012 |
| CHA2DS2-VASc | 2.8 ± 1.0 | 4.1 ± 1.1 | 3.7 ± 0.6 | 0.001 |
| CHADS2 | 1.3 ± 0.8 | 2.6 ± 0.8 | 2.1 ± 0.2 | <0.001 |
Rutherford stage and scores
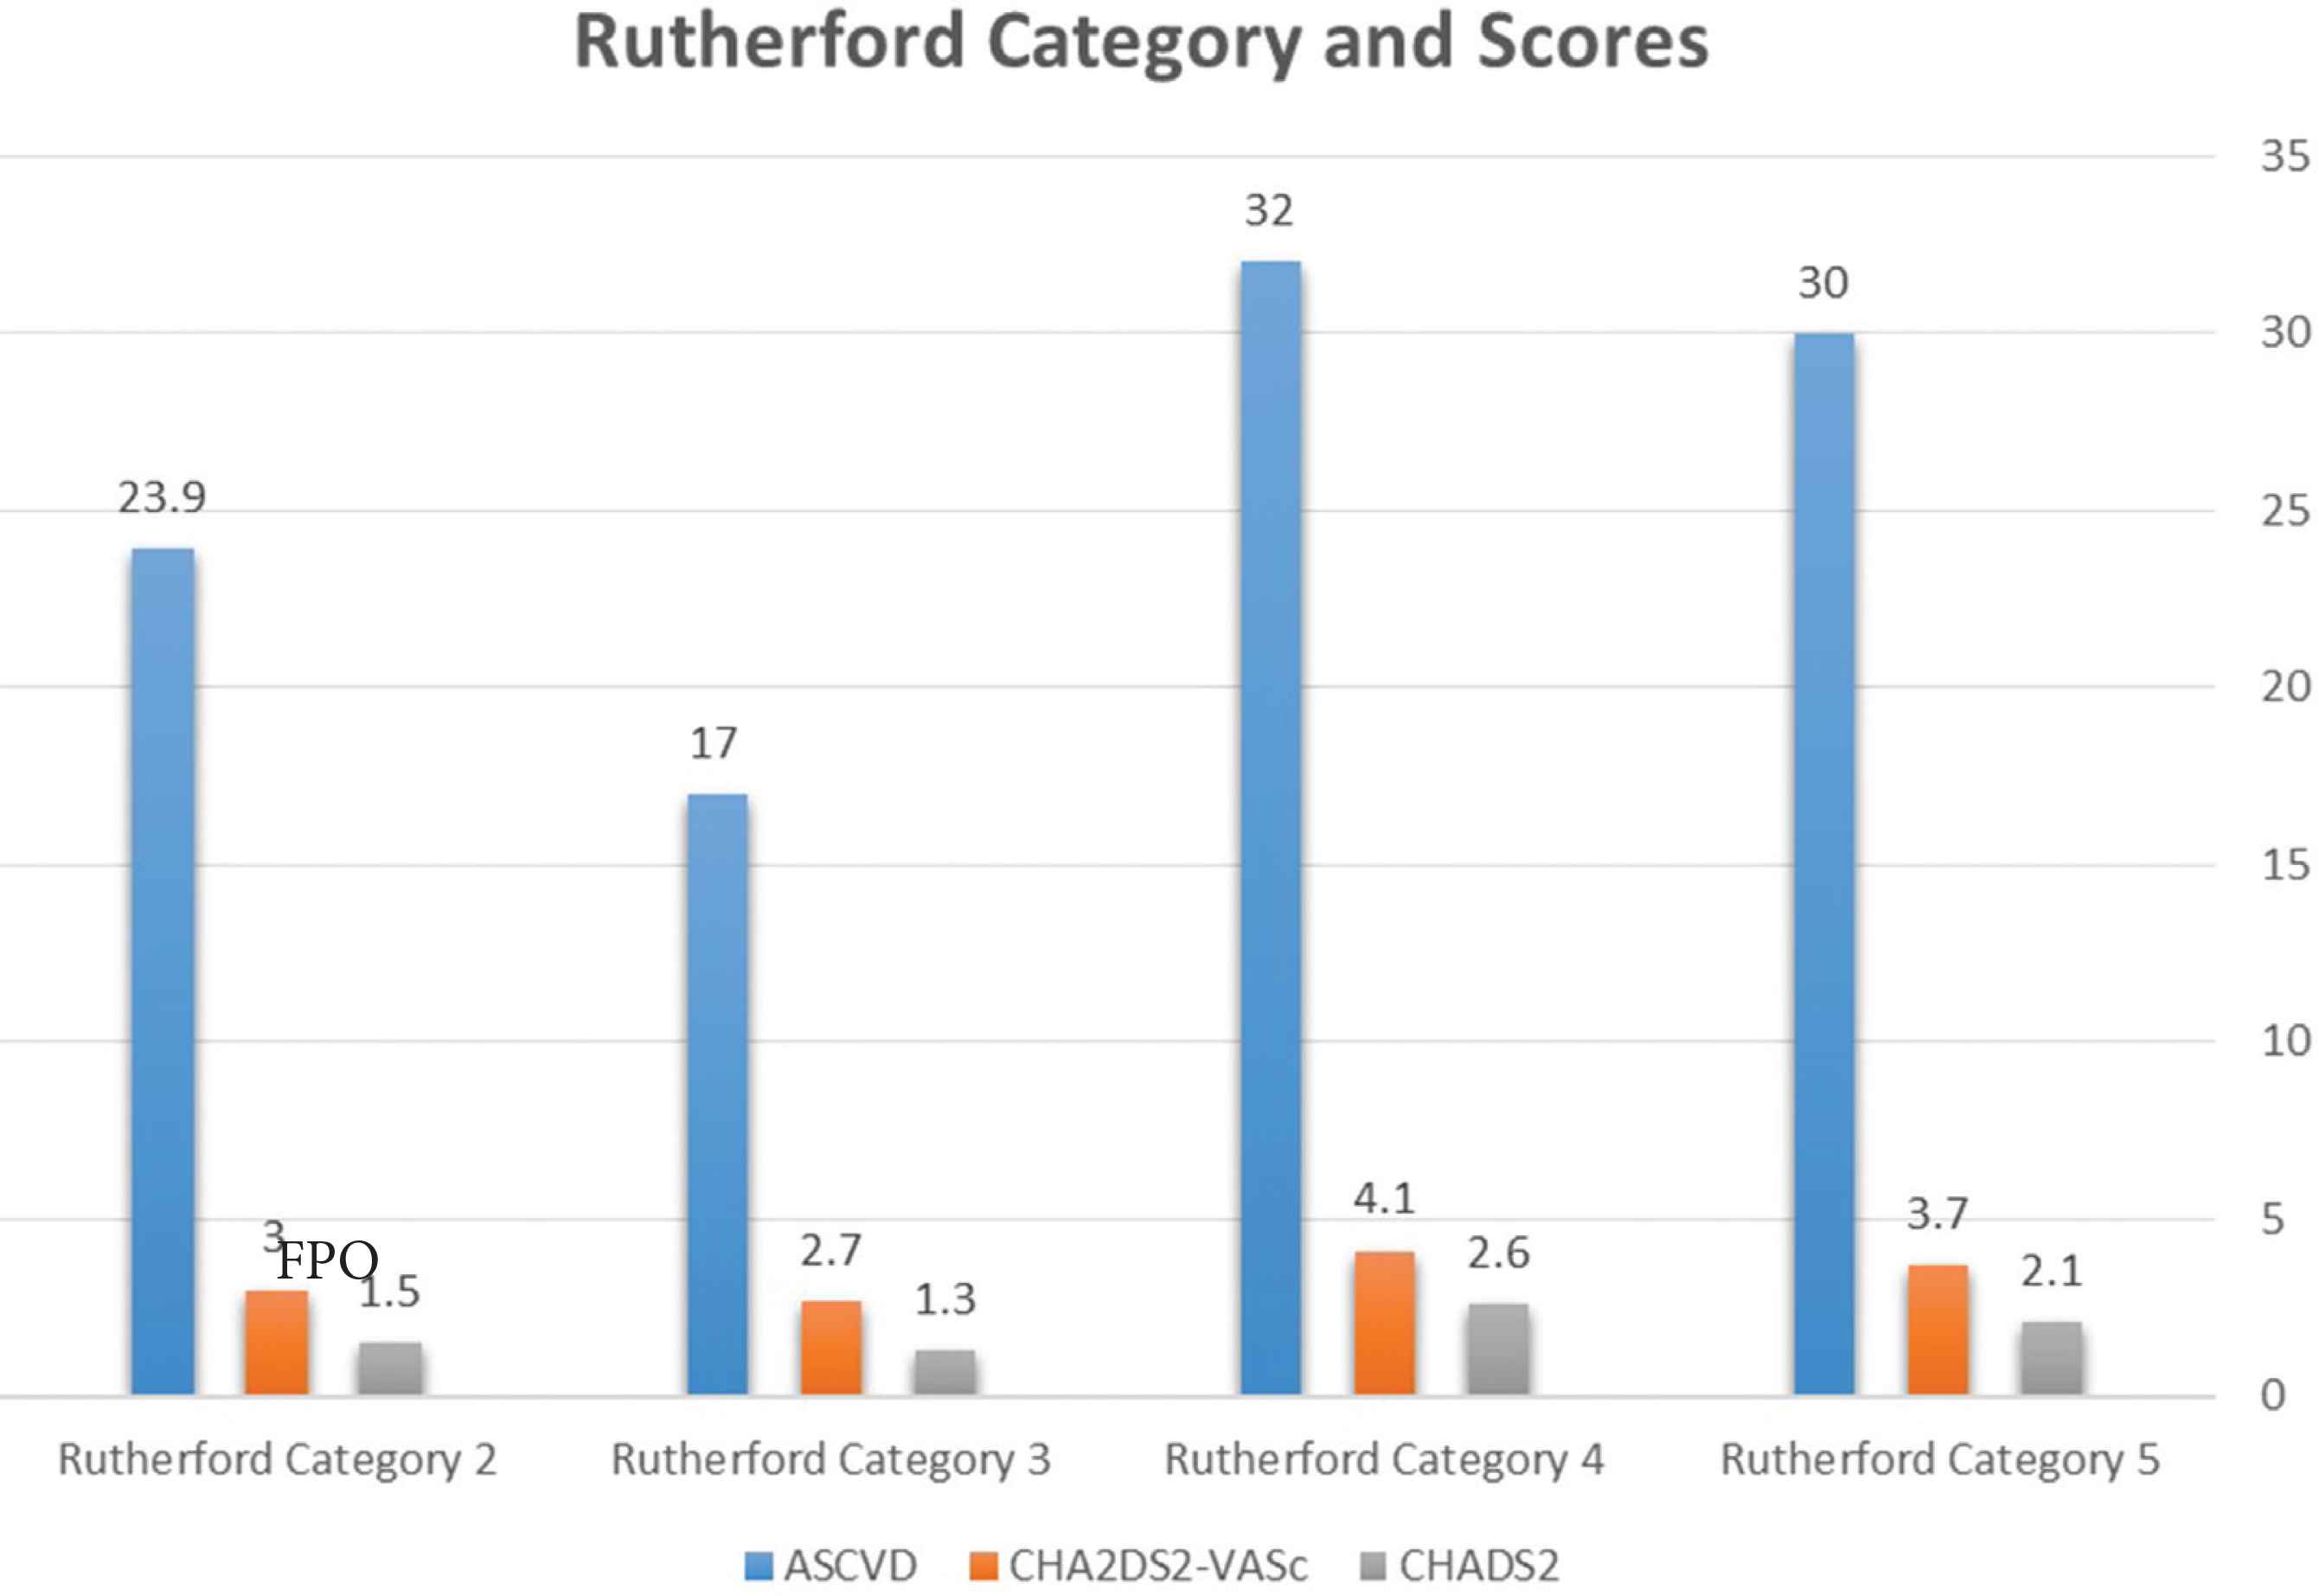
The association between the Rutherford Category and the scores.
4. DISCUSSION
In this study, we evaluated the association of Rutherford classifications with CHADS2, CHA2DS2-VASc and ASCVD scores. The major finding of the present study is that the CHADS2, CHA2DS2-VASc and ASCVD scores was independently correlated with the severity of Rutherford Category in patients with PAD.
Peripheral artery disease often affects 13% of the population over 50 years of age with stenosis or occlusion due to atherosclerosis [7]. In our study, the mean age of the patients was 63.0 ± 9.2 years and the age increased as the category increased. A frequent symptom of PAD is painful pain in the leg muscles that pass through rest, triggered by walking, known as intermittent claudication. CLI is an advanced stage of PAD and is manifested by rest pain, ulceration, gangrene and/or tissue loss in the extremities. The classification system is important in assessing the severity of PAD and making the treatment decision. Although there are many classification systems in this area, the most common and useful ones are Rutherford and Trans-Atlantic Inter-Society Consensus II (TASC) classifications. However, classification systems may not be sufficient and scoring systems developed to predict cardiovascular and cerebrovascular events can also be useful to assess the severity of PAD. Because having atherosclerosis in the extremities is not only associated with complications associated with it, but also carries a high risk of CV and cerebrovascular morbidity and mortality due to concomitant atherosclerotic disease and concomitant risk factors in other vascular beds [8,9].
In order to properly select prevention and treatment strategies, clinicians need viable, reliable, simple and objective tools to define patient risk limits. The CHADS2, CHA2DS2-VASc and ASCVD scoring models are clinical predictors used to determine the risk of thromboembolism and CV risk estimate [4,5]. These risk scores are widely used in clinical practice and include similar risk factors for the development of PAD. A few observational and epidemiological studies have reported the association between PAD and scoring systems. CHADS2 and CHA2DS2-VASc scores models were studied in non-AF patient groups and were found to be effective and usable [10–12]. In these four studies, these scoring models were shown to be associated with CAD severity and predicting events. However, data on PAD on this issue are limited in the literature. In the studies of Hsu et al. [13–15] evaluated the association between Ankle-Brachial Index (ABI) and CHADS2 and modified CHA2DS2-VASc scores. In the first study, they showed that the association between CHADS2 score and ABI < 0.9 and confirmed CHADS2 score was significantly associated with ABI < 0.9 in non-AF patients [13]. After than they demonstrated that CHADS2 score was useful in predicting the risk of new-onset PAD [14]. In their last study determined that modified CHA2DS2-VASc score was significantly associated with ABI < 0.9 and they argued that calculation of modified CHA2DS2-VASc score may be beneficial in recognizing patients with PAD and in graduating the risk of PAD [15]. In our study, the results are consistent with the results in these studies and as well as these scores, ASCVD score model has been shown to be related to the PAD stage. The CHADS2 ≥2 and CHA2DS2-VASc ≥4 are well-known risk factor for other atherosclerotic disease and AF. Our present study in peripheral artery disease patients, similarly, found that the Rutherford Category was significantly high in the CHADS2 ≥2 and CHA2DS2-VASc ≥4 groups. Based on these data, it is thought that the patient’s Rutherford stage can be estimated according to the CHADS2, CHA2DS2-VASc and ASCVD scores or CHADS2 and CHA2DS2-VASc groups in patients with peripheral artery disease.
Several multivariable risk prediction algorithms incorporating major risk factors have been developed to assess the risk of atherosclerotic CVD, such as the European SCORE and ASCVD score systems [5,16]. The ASCVD, a gender-specific algorithm used to estimate the 10-year risk of developing CAD, was first developed based on data obtained from the Framingham Heart Study. In our study, we used the ASCVD scoring model, which was not previously studied in the literature, and showed that it is higher in the advanced Rutherford Category. While there is a statistically significant negative correlation between Rutherford Category level and gender, DM and walking distance without claudication, there is a statistically significant positive correlation with CHADS2, CHA2DS2-VASc scores and CHADS2 ≥2 and CHA2DS2-VASc ≥4 groups.
4.1. Study Limitations
There are several limitations of this study. First of all this study is a retrospective trial and the sample size is small. Another limitation of the study is the comparison according to the degree of Rutherford Classification and the absence of control group. Since our center is a reference center, as long-term follow-up data is limited, the effect on mortality is uncertain. The present our study was of a single-center retrospective design with a small sample size, and so the results might differ if a larger population were used.
5. CONCLUSION
According to the results obtained from our study, high CHADS2, CHA2DS2-VASc and ASCVD scores have been shown to be associated with advanced Rutherford Classification. Further large randomized studies are needed in PAD patients and scoring systems.
CONFLICTS OF INTEREST
The authors declare they have no conflicts of interest.
AUTHORS’ CONTRIBUTION
BDK and HA contributed in literature search, study conceptualization, study design, data collection, data analysis and manuscript writing. TK and EB contributed in curation and literature search.
FUNDING
There is no funding.
Footnotes
REFERENCES
Cite this article
TY  - JOUR
AU  - Bilge Duran Karaduman
AU  - Hüseyin Ayhan
AU  - Telat Keleş
AU  - Engin Bozkurt
PY  - 2020
DA  - 2020/05/07
TI  - Association between Rutherford Classification and CHA2DS2-VASc, CHADS2 and ASCVD Scores in Peripheral Artery Disease Patients
JO  - Artery Research
SP  - 111
EP  - 116
VL  - 26
IS  - 2
SN  - 1876-4401
UR  - https://doi.org/10.2991/artres.k.200504.001
DO  - 10.2991/artres.k.200504.001
ID  - Karaduman2020
ER  -