
Waves in arteries: A review of wave intensity analysis in the systemic and coronary circulations
- DOI
- 10.1016/j.artres.2008.02.002How to use a DOI?
- Keywords
- Waves; Pressure waveform; Hemodynamics; Circulation; Aorta; Coronary artery
- Abstract
The intermittent ejection of blood by the ventricle results in pulsatile pressure and flow waveforms in the circulation. Understanding and characterizing this pulsatile behaviour is attracting increasing clinical interest, as it may have important implications for risk prediction and the mechanisms of action of therapeutic agents. This review focuses on the theory and use of wave intensity analysis to analyse pulsatile waveforms in the arterial circulation with particular reference to the coronary circulation.
- Copyright
- © 2008 Association for Research into Arterial Structure and Physiology. Published by Elsevier B.V. All rights reserved.
- Open Access
- This is an open access article distributed under the CC BY-NC license.
Background
The medical significance of the arterial pulse has intrigued observers at least for over 2000 years (cited by Fung1), and both Leonhard Euler2 and Thomas Young3 discussed waves in the arterial circulation over 200 years ago. In the 1950–1960s, Womersley and McDonald (cited by Milnor4 and Nichols and O’Rourke5) made major contributions to the understanding of fluid motion and waves in the circulation. More recently, waves in arteries have received increased attention as a possible independent mediator of cardiovascular risk6–10 and a potential therapeutic target.11–13
A wave is a disturbance that is propagated through a medium with an exchange between kinetic and potential energy. Implicit in this definition, though sometimes not appreciated, is that waves in the arterial circulation necessarily involve simultaneous changes in pressure and flow. It is also worth emphasizing that a wave involves the transmission of energy through displacement of particles or medium (blood) without implying a bulk movement of the medium. Hence waves can, and do, travel at speeds considerably faster than the bulk flow velocity of blood in the circulation. Often when people think of waves they think of transverse waves (e.g. waves in a violin string or a ‘Mexican’ wave at a sports stadium) where the displacement of the particle or medium is perpendicular to the direction of wave propagation; however, in the case of waves in arteries, the waves are predominantly longitudinal waves (i.e. the displacement of the medium is parallel to the direction of wave propagation), akin to acoustic waves or longitudinal waves in ‘slinkies’ (Fig. 1). The major difference between wave propagation in a rigid fluid-filled tube and an elastic fluid-filled tube (e.g. a blood vessel) is that the effective compressibility is the sum of the true compressibility of the fluid and the distensibility of the tube.14 This accounts for the much lower wave speeds seen in arteries than in rigid tubes.
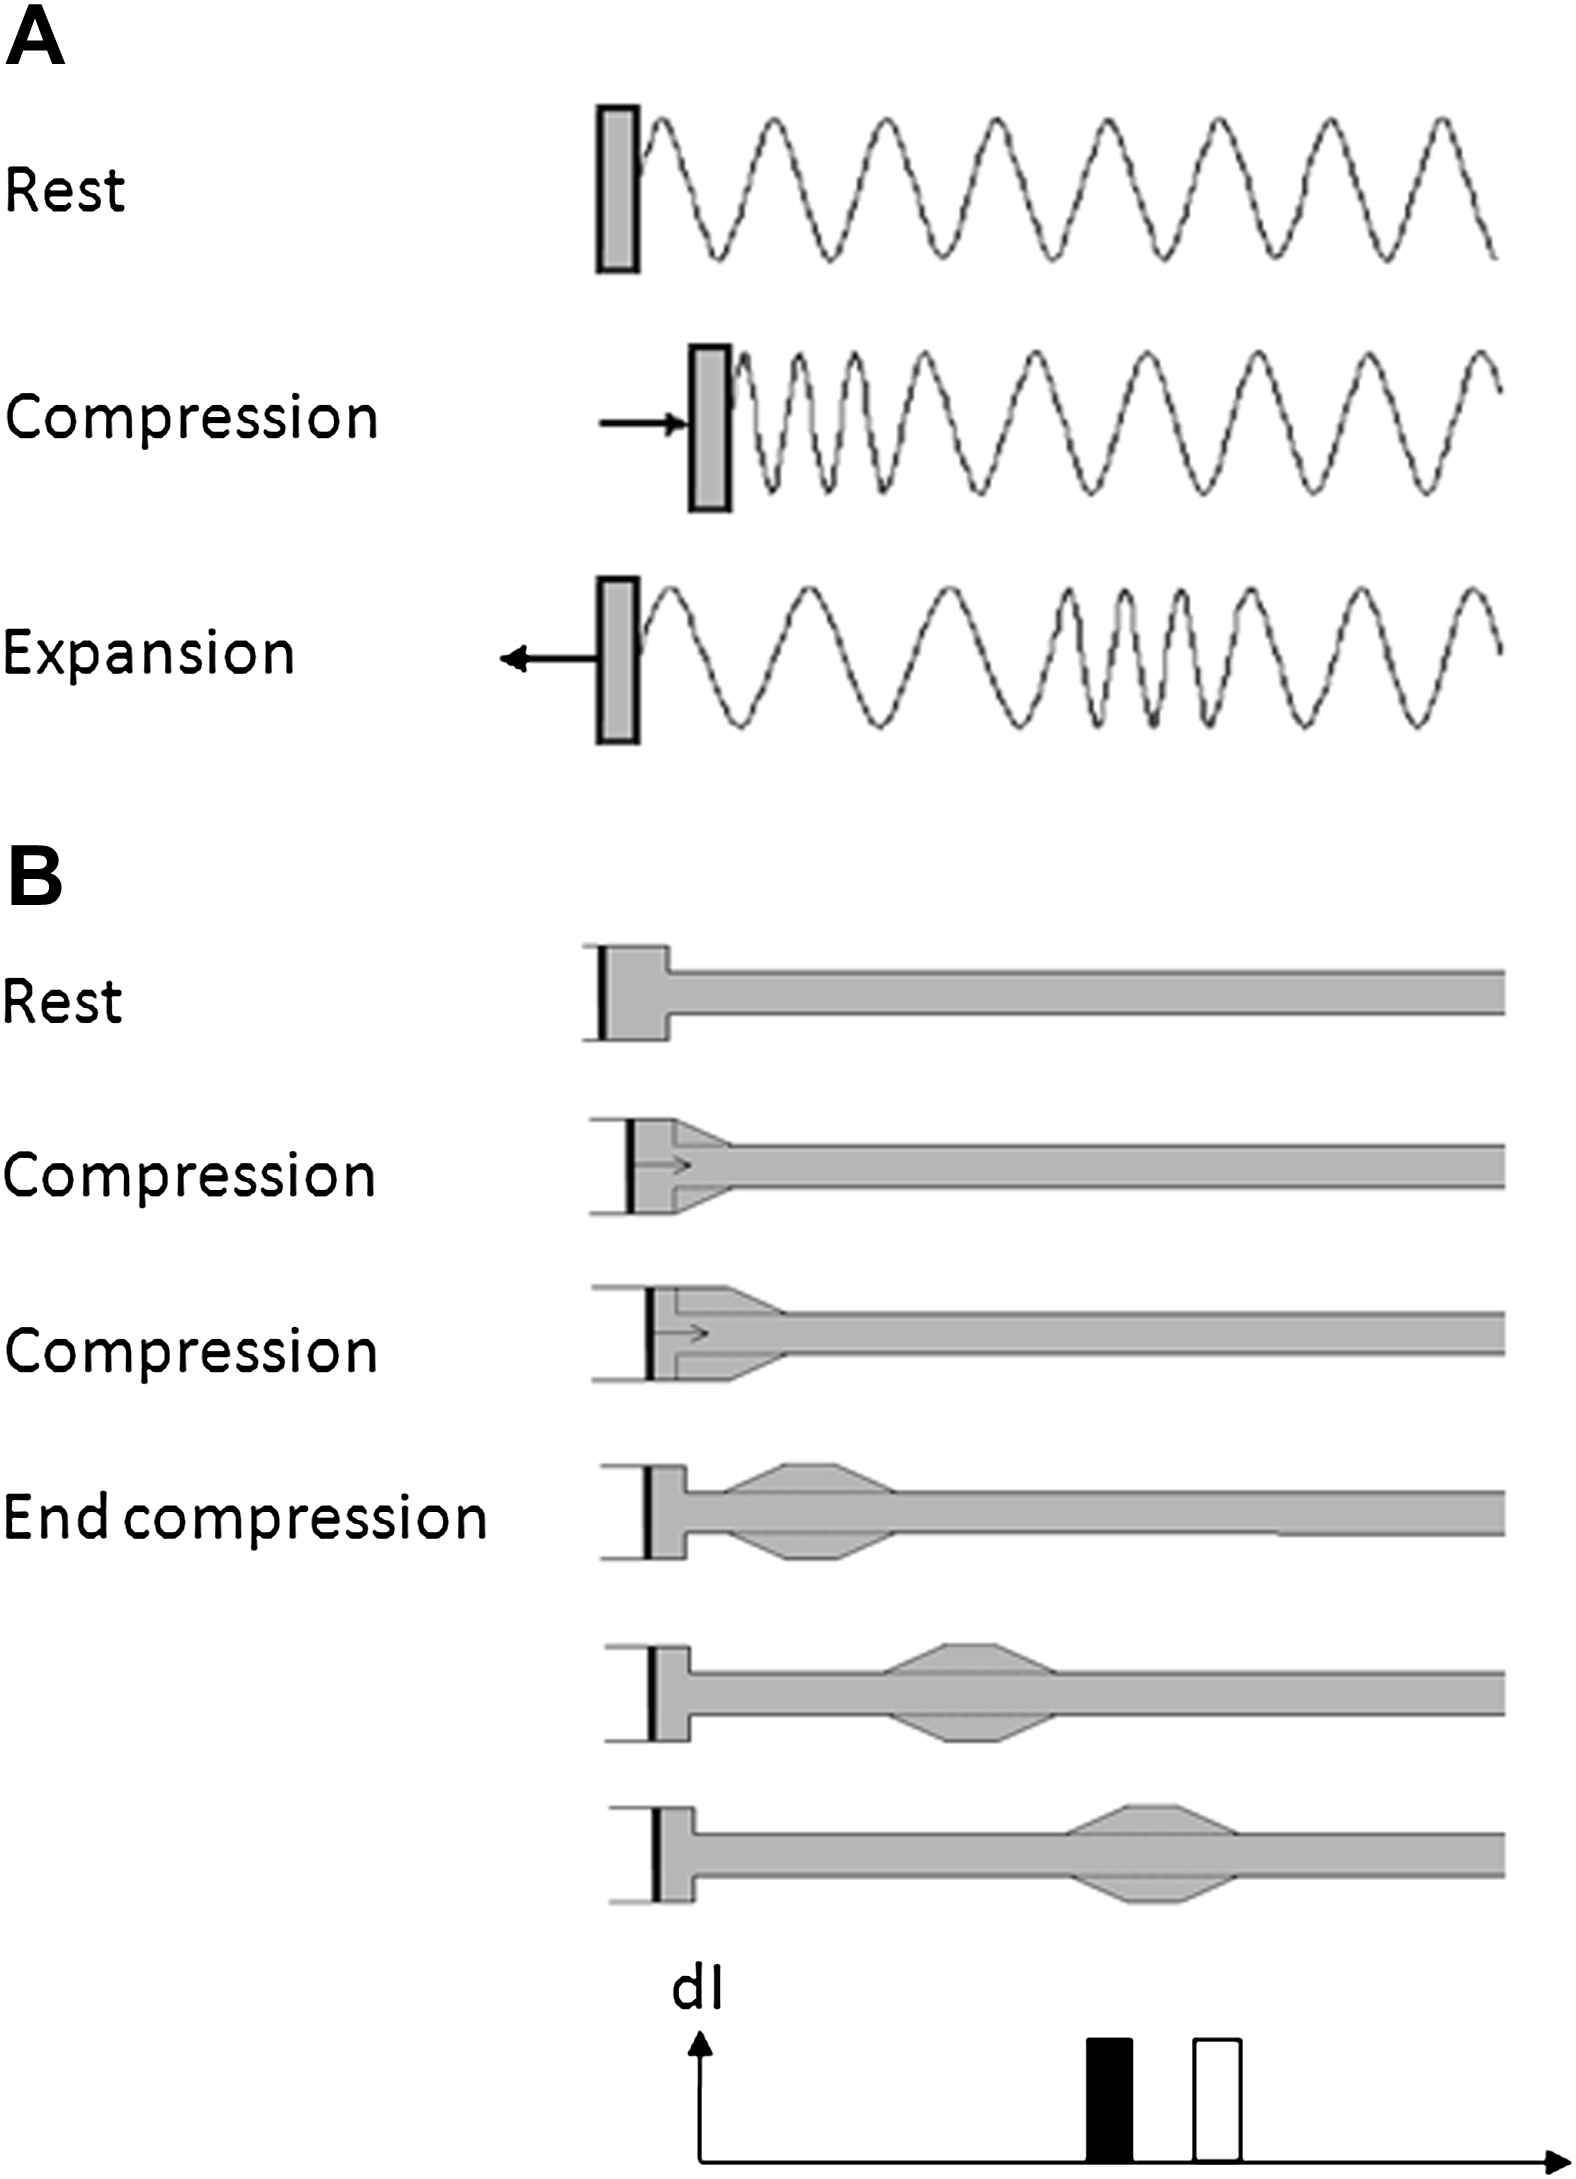
Compression and expansion waves in (A) a ‘slinky’ and (B) a fluid-filled tube connected to a syringe pump. In (A) the slinky is compressed transmitting a compression wave that travels along the slinky. The slinky is then expanded causing a second expansion wave to follow the initial compression wave. In (B) the fluid displaced by the piston flows into the elastic tube distending it. In the next time interval the fluid continues to flow into the tube further distending the tube. The change in flow velocity and pressure in the tube generates a forward wavefront that propagates along the tube at the wave speed determined by the lumped distensibility of the tube and the fluid. At the next time point the piston is decelerated back to zero velocity and the velocity of the fluid moving into the tube decreases. This change in velocity and pressure causes a forward travelling expansion wave that decelerates flow. Both compression and expansion wave continue to propagate along the tube. The wave intensity at the last time interval is shown at the bottom of the figure with the acceleration (compression) wave unshaded and the deceleration (expansion) wave shown filled.
From a fluid or gas dynamics perspective, longitudinal waves can be characterized as compression waves or expansion waves (Fig. 1). These types of waves are characterized by the rate of change of pressure (dP/dt) they cause; compression wavefronts have dP/dt > 0; for expansion wavefronts dP/dt < 0. One apparently anomalous consequence of this definition is that compression wavefronts in arteries are associated with an expansion in arterial diameter, while expansion wavefronts are associated with a reduction in arterial diameter. However, less confusingly, compression of the blood stored in the ventricle during systolic contraction and ejection results in a forward travelling compression wavefront, while a reduction in the rate of ventricular contraction in protodiastole is associated with generation of an expansion wavefront slowing aortic blood flow and assisting aortic valve closure.15
Traditionally analysis of waves in the circulation has employed impedance analysis, a technique based on the Fourier transform.4,5 This approach considers waves as superimpositions of sinusoidal wave trains (harmonics) with different magnitudes, frequencies and phase. Impedance analysis is a powerful tool that has provided extensive insights into circulatory physiology, but it assumes linearity and periodicity of waves. In other words, waves are assumed to add together and the circulation is assumed to be in a state of steady-state oscillation. This latter assumption implies that a given pulse can be influenced by the reflection of waves that originated in preceding cycles.4 This view is in conflict with observations made following ectopic, or missed beats, where there is no evidence of a residual oscillation in pressure.16 In practice, however, heart rate is relatively stable in the majority of situations subjected to impedance analysis and the assumption of periodicity in these settings seems reasonable. A less fundamental, but practical limitation of impedance analysis is that it presents findings in the frequency domain, a mode that is less immediately interpretable than time-domain based results, at least for most researchers. These considerations have led to the development of time-domain based analytical techniques for wave analysis in circulation that do not assume linearity or periodicity15,17–25 of which the wave intensity approach formulated by Parker et al.15,21 has been perhaps most widely used. This approach has the advantages that it can be used in non-linear systems and permits wave power, wave energy and the timing of waves to be quantified.
Wave intensity analysis
Principles
As mentioned above, a characteristic property of waves is that they allow the transport of energy without the need for net transport of material. By analogy with acoustic theory, the ‘wave energy’ is the part of a fluid’s total energy, that is associated with a wave; while the ‘wave intensity’ is the rate of transport of wave energy, i.e. the instantaneous power carried by the wave per unit cross sectional area. The work done by the wave involves both kinetic energy associated with the velocity of flow and potential energy associated with expansion of the arterial wall (since blood is assumed to be effectively incompressible). Wave energy and wave intensity are commonly expressed as J m−2 or W m−2, respectively, although it has been proposed that wave intensity should be normalized with respect to the product of the derivatives of pressure (dP/dt) and velocity (dU/dt)with respect to time.26 Such an approach has merit, since it allows data acquired at different sampling rates to be compared directly, but results in complex units (e.g. W m−2 s−2 or mm Hg m s−3) that are not direct measures of wave power and complicate the calculation of wave energy. It should be noted that wave energy and wave intensity in the circulation comprise only a fraction of total energy and power associated with ventricular work.27,28 On the basis of the work by Khir et al.,27 who measured wave intensity in the human aorta during peripheral vascular surgery, peak wave intensity in systole was ∼30% of total hydraulic power per unit area (∼70 W m−2 vs. 223 W m−2, respectively). The estimate of peak wave intensity reported by Khir et al. is somewhat higher than the intensity reported by others in other species or settings (∼25 W m−2 in sheep,29 37 W m−2 in dogs,30 30 W m−2 in people with normal coronary arteries at the time of angiography, all adjusted to a sampling rate of 200 Hz). To put the magnitude of wave intensity into a broader context, the minimal acoustic wave intensity detectable by the human ear is around 10−12W m−2 and sound intensities of >1 W m−2 are associated with auditory discomfort.31 It is therefore plausible that the power and energy invested in waves reveals important information regarding ventricular performance and the state of the circulation, particularly with regard to wave reflection. Wave intensity and wave energy are calculated by wave intensity analysis. This is a one-dimensional analytical technique that employs the ‘method of characteristics’ to assess wave travel at a specific location in the circulation. The approach is based on Riemann’s invariant theory and similar approaches are widely employed for the analysis of non-linear effects in wave travel in gases and fluids, including shock waves (see Lighthill14 for a lucid exposition of the principles). The method of characteristics follows the propagation of infinitesimal waves (wavelets) in space and time and makes no assumptions regarding linearity or periodicity. Details of the mathematics of wave intensity analysis can be found elsewhere.15,21,26 To perform wave intensity analysis only pressure (or arterial diameter changes) and flow velocity data from the same measurement site are required. These data are relatively easy to obtain using invasive or non-invasive techniques (Figs. 2 and 3). Ideally these data should be acquired simultaneously, although sequentially acquired data has been successfully used.28,32 In itself, wave intensity analysis only provides information regarding the direction of net wave travel. However if the system is assumed to be linear (i.e. waves in different directions interact additively) then wave separation can be performed on the basis of the ‘Water Hammer’ equation, assuming that the local wave speed (c) is known.21 This technique of wave separation gives results that are very similar, if not identical, to impedance-based approaches, if the product of c × ρ (density of blood) is accepted as an estimate of characteristic impedance (Zc) per unit area.5,33
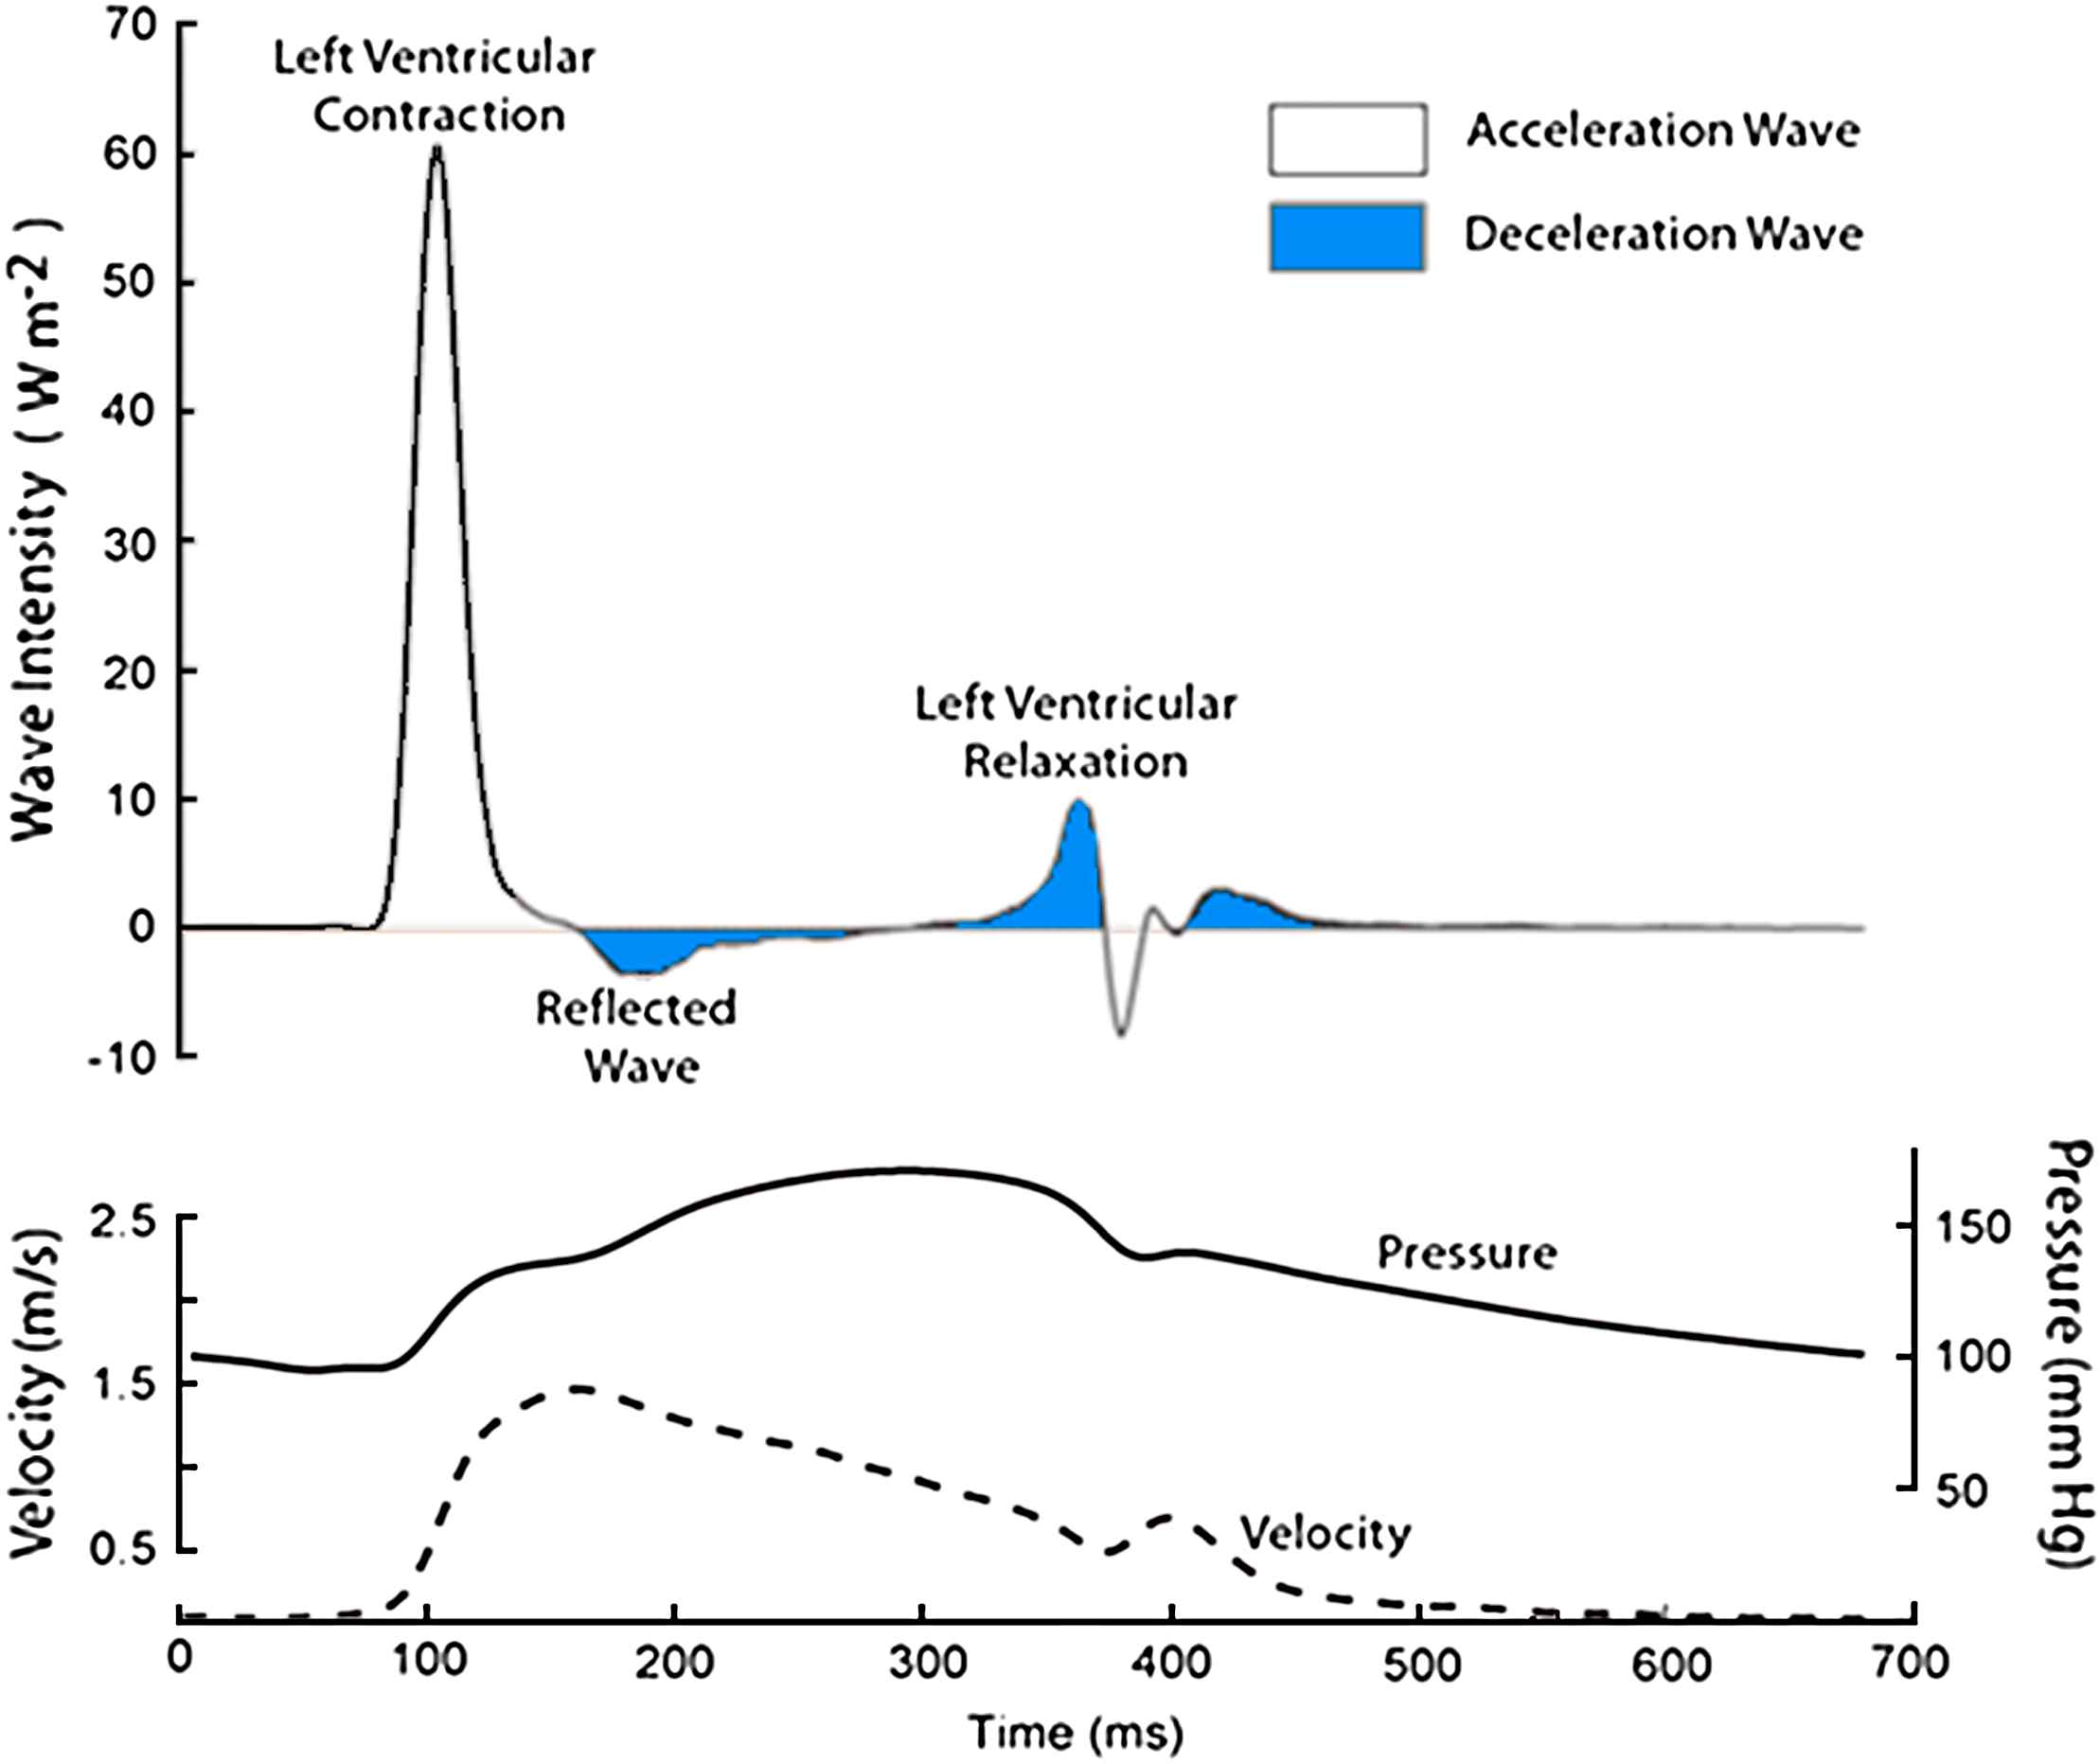
Wave intensity analysis in the proximal aorta. Simultaneous measurements of pressure and maximum flow velocity were made using a combined pressure-flow wire in a subject undergoing coronary angiography. Data were ensembled averaged and analysed using custom-written software. Waves were separated into those originating the proximal end (positive wave intensities) and those originating from the distal end (negative wave intensities). In the figure they are colour coded according to the effect they have on blood flow: waves shaded blue decelerate blood flow, and unshaded accelerate blood flow. For example, a forward compression wave (left ventricular contraction) accelerates blood flow, while a forward expansion wave (left ventricular relaxation) decelerates flow. A backward travelling compression wave (reflected wave) decelerates flow.
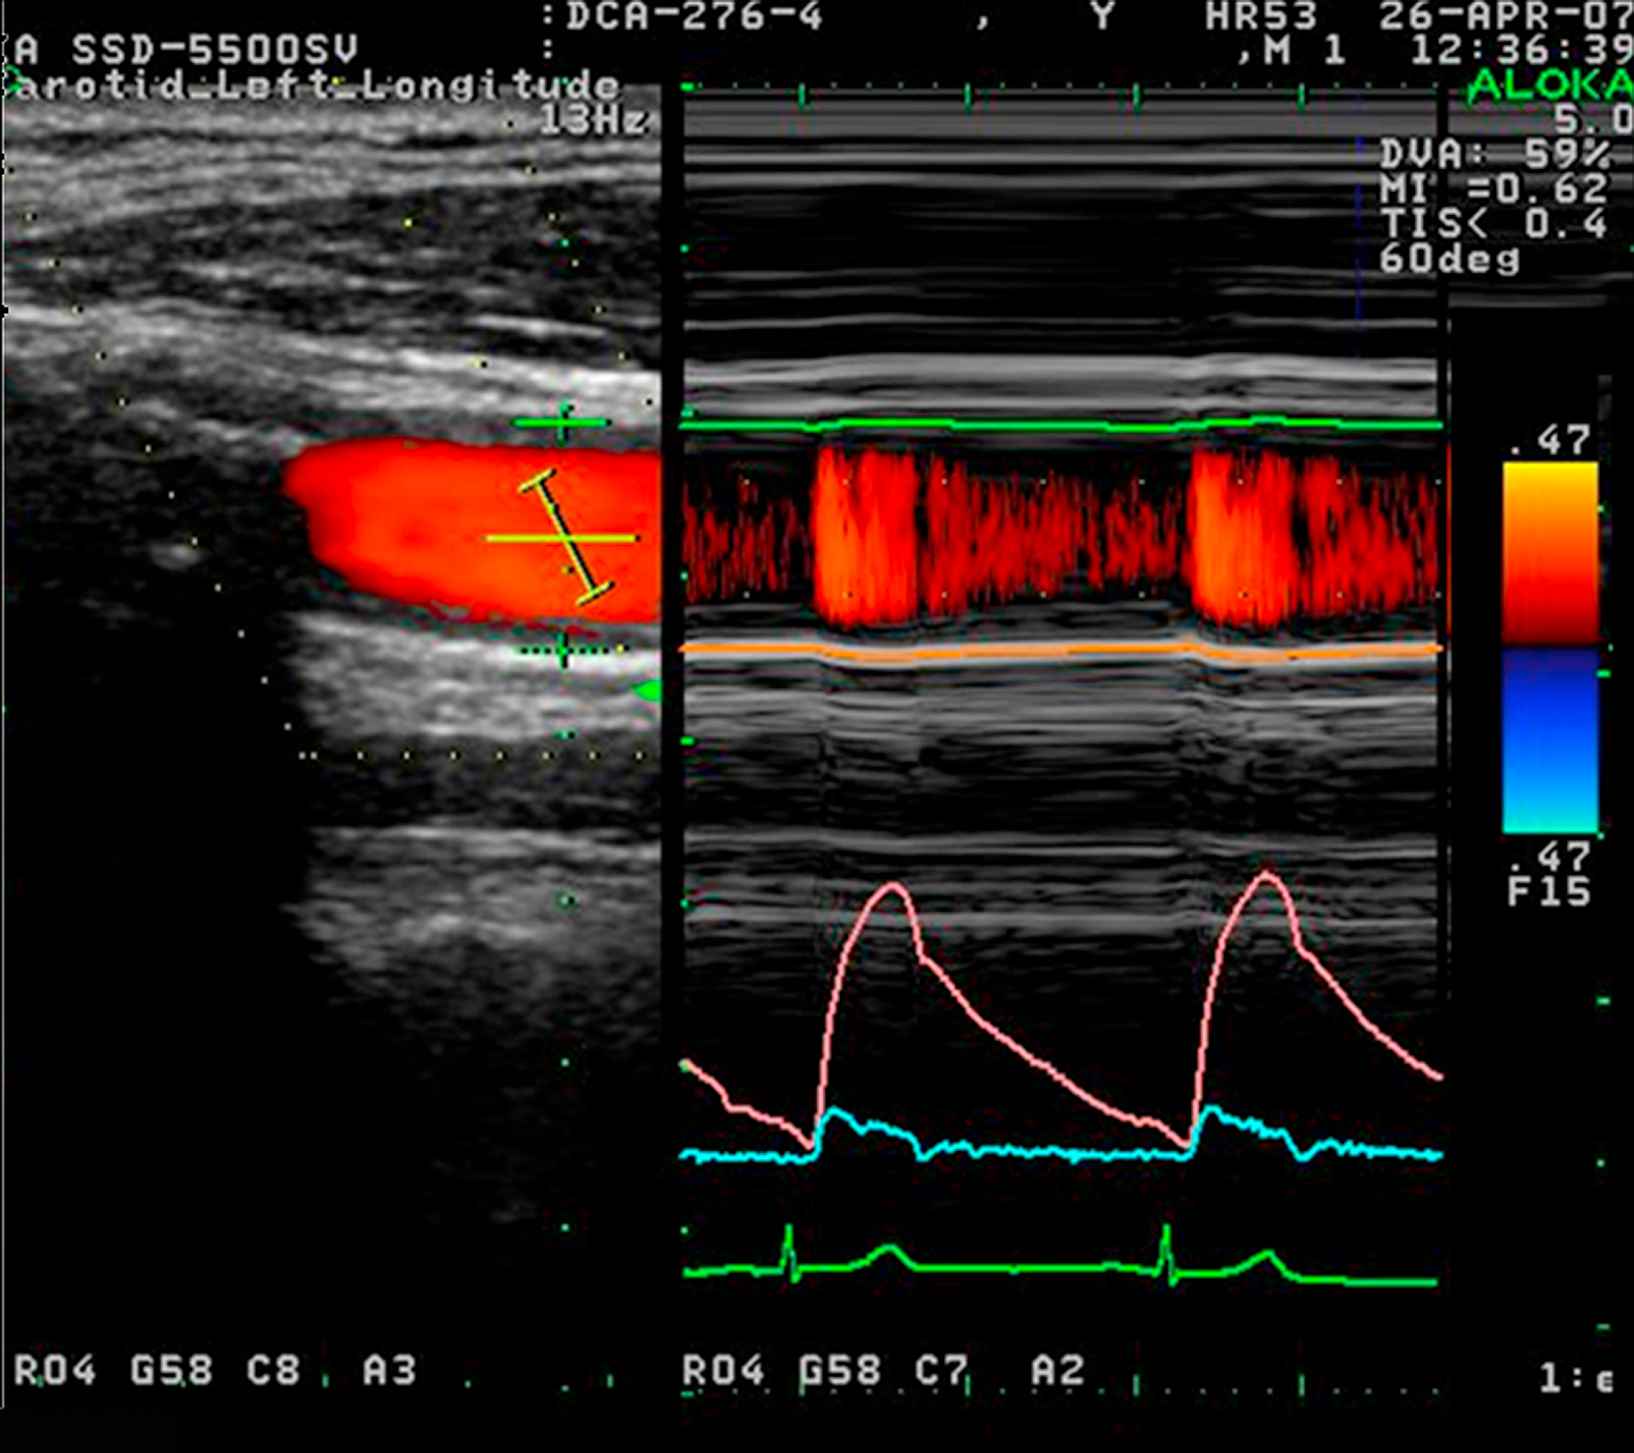
Non-invasive wave intensity analysis in the carotid artery measured using ultrasound. Flow velocity was calculated from colour Doppler (lower right panel, blue) while the change in arterial diameter was measured using a wall tracking method (middle right panel, pink) and calibrated to pressure using a brachial sphygmomanometry. All measurements were made using an Aloka SSD-5500 and commercial software.
Wave intensity analysis in the aorta and systemic arteries
Since its original description, a number of investigators have used wave intensity analysis to aid the understanding of physiological events in the arterial system. In addition to studies in the aorta,5,21,26,34–36 coronaries37–39 and other systemic arteries,28,40,40–43 wave intensity analysis has also been applied to the pulmonary circulation,44 the venous circulation,45 the chambers of the heart46–52 and cardiac assist devices,53,54 but consideration of these interesting studies falls outside the scope of this review.
Studies in the aorta have shown a relatively consistent pattern of wave intensity peaks (Fig. 2). The first and dominant peak intensity is a forward travelling compression wave (a pushing wave), which occurs when pressure and flow velocity rise simultaneously in the aorta. This occurs as a result of ventricular ejection and accelerates aortic blood flow. This is closely followed by a smaller backward-travelling compression wave or ‘reflected wave’, which originates from the distal circulation. This wave is thought to arise when the forward-travelling compression wave is reflected back towards the proximal aorta from distal sites of impedance mismatch. Observations in dog and man,27,30,35 showing the effect of arterial occlusion on this wave, are consistent with this interpretation. This wave increases total pressure, but decelerates blood flow. Towards the end of systole (protodiastole of Wiggers) there is a forward-travelling expansion (suction) wave that results from deceleration of ventricular contraction before closure of the aortic valve. The effect of this wave is to decelerate blood in the aorta15,55 and contribute to aortic valve closure. Relatively similar patterns of wave intensity have also been seen in carotid artery,28,40,41,56 brachial artery,28 radial artery,28 and the femoral artery (Hughes and Zambanini, unpublished data), although the magnitude of the wave intensities differ between sites and in some cases additional waves, possibly arising as a result of re-reflection of these principal waves, are also evident.
Effect of drugs and disease on wave intensity
A few studies have examined the effect of cardio- or vasoactive agents on wave intensity. Jones et al.36 investigated the effect of intravenous infusion of the β1-adrenoceptor agonist, dobutamine, the β-adrenoceptor antagonist, propranolol, the α1-adrenoceptor agonist methoxamine, and the organic nitrate, nitroglycerin, on net (i.e. unseparated) wave intensity in anaesthetized dogs. Dobutamine and propranolol were associated with an increase and decrease respectively in the systolic forward compression wave, without affecting the protodiastolic expansion wave. Methoxamine caused a decrease in the systolic forward compression wave without affecting the protodiastolic expansion wave, while nitroglycerin caused a decrease in both the systolic forward compression wave and the protodiastolic expansion wave. These findings appear consistent with the known positive and negative inotropic effects of dobutamine and propranolol and the anticipated effect of methoxamine on afterload. The effect of nitroglycerin was interpreted as being due to reduced venous return and preload. In contrast Niki et al.,57 using a non-invasive technique to undertake wave intensity analysis in the carotid artery in man reported that sublingual nitroglycerin caused an increase in the systolic forward compression wave and an increase in a mid-systolic expansion wave (X wave) without affecting the protodiastolic forward expansion wave. The absolute magnitude of the reflected compression wave was not significantly influenced by nitroglycerin, implying a decrease in reflection since the incident systolic compression wave was increased. It is uncertain whether differences between the observations in man and dog relate to dose of nitroglycerin or differences in site of measurement. In another non-invasive study in the carotid artery of hypertensive subjects Fujimoto et al.58 reported that blood pressure lowering with doxazosin, an α1-adrenoceptor antagonist, resulted in an increase in both the systolic forward compression wave and the forward protodiastolic expansion wave and a reduction in intensity of wave reflection. These observations mirror the effect of the α1-adrenoceptor agonist reported by Jones et al. in the dog and are likely to be attributable to the vasodilator action of doxazosin. More recently, Swampillai et al.59 investigated the effects of caffeine and nicotine on left-ventricular and arterial interactions using wave intensity analysis. Caffeine increased the magnitude of the systolic forward compression wave probably as a result of increased sympathomimetic effects on left ventricular function. Cigarette smoking had no effect on wave intensity but acutely increased the β stiffness index of the common carotid artery. Bleasdale et al.56 also used non-invasive wave intensity analysis to show that increasing inspired CO2 by re-breathing significantly decreased the magnitude of the intensity of the reflected wave in the human carotid artery They concluded that this simple technique may prove a useful non-invasive tool for the assessment of cerebrovascular tone in the future.
Studies of wave intensity analysis in cardiovascular disease are limited at present. Compared with normal subjects, people with mitral regurgitation were reported to have a markedly reduced protodiastolic forward expansion wave, although the systolic forward compression wave appeared similar in the carotid artery.41 Following valve surgery, the protodiastolic forward expansion wave recovered to levels comparable with normal subjects, suggesting some restoration of left ventricular lusitropic function. Curtis et al.32 reported that the systolic forward-travelling compression wave was substantially smaller in subjects with chronic heart failure compared with normal individuals, but that wave reflection was increased. They suggested that heart failure compromises the ability of the left ventricle to generate a compression wave, but that increased wave reflection serves to maintain systolic blood pressure, albeit at the expense of an additional load on ventricular function.
Wave intensity analysis in coronary arteries
The flow velocity waveform in the left coronary arteries differs markedly from that of the aorta even though it is only a few millimetres away (Fig. 4). In contrast the pressure waveforms in the aorta and the left coronary arteries are almost identical. Several explanations have been put forward to explain the predominantly diastolic phasic nature of coronary blood flow. These include the coronary waterfall model, the inter-myocardial pump mechanism and the time-varying elastance model (reviewed by Hoffman and Spaan60 and Westerhof et al.61). Common to all these models is the idea first articulated by Scaramucci62 and subsequently confirmed by many others63 that the contraction of the ventricle impedes systolic flow into the myocardial tissue. The vascular waterfall mechanism proposed by Downey and Kirk64 envisages that if intramyocardial pressure exceeds coronary perfusion pressure, the vessels will collapse and resistance will increase. This proposal accounts for the systolic obstruction to arterial flow but has been viewed as inconsistent with observations showing that coronary venous flow is maximal in systole (i.e. ∼180° out of phase with coronary arterial flow) and that reverse flow can be seen in early systole. Consequently, Spaan and colleagues65,66 proposed an ‘intramyocardial pump’ model. In this model the myocardium itself acts as a pump for the coronary arteries, restricting inflow (and increasing outflow) during systole, while permitting inflow during diastole. The underlying idea is that flow variations are not primarily due to resistance changes, but to forced displacement of blood volume as a result of the changes in intramyocardial tissue pressure. An alternative model proposed by Krams et al.67,68 is the time-varying elastance model. This model was based on the observations that the impediment to coronary flow in isobaric beats was similar to that in isovolumic beats, but an increase in the contractility resulted in increased flow impediment in the beating heart. It was therefore proposed that the contractility (considered as a time-varying elastance) rather than the intramyocardial pressure determined the impediment to coronary flow. Evidence exists for both intramyocardial pressure and ventricular elastance models influencing coronary flow and they are not necessarily mutually exclusive mechanisms.61 The magnitude of the changes imposed on the coronary microcirculation has been measured from its volume fraction under systolic and diastolic conditions.69,70 These studies indicate that the volume change between systole and diastole is of the order of 30–40%. Most of this volume change is ascribed to the pre-capillary circulation. Since the main resistance to flow is thought to reside in the pre-capillary arterioles,71 this measurement of volume change allows us to estimate the change in resistance during systole. Assuming that the microvessels do not change length significantly during the contraction of the myocardium, then the relationship between the change in volume (ΔV) and the change in diameter (ΔD) will be ΔV ≈ 2ΔD. A 40% change in volume would therefore correspond to a 20% reduction of diameter during systole; assuming that the resistance follows Poiseuille’s law, this would imply a 2.5-fold increase in resistance of the coronary microcirculation during systole compared with diastole.
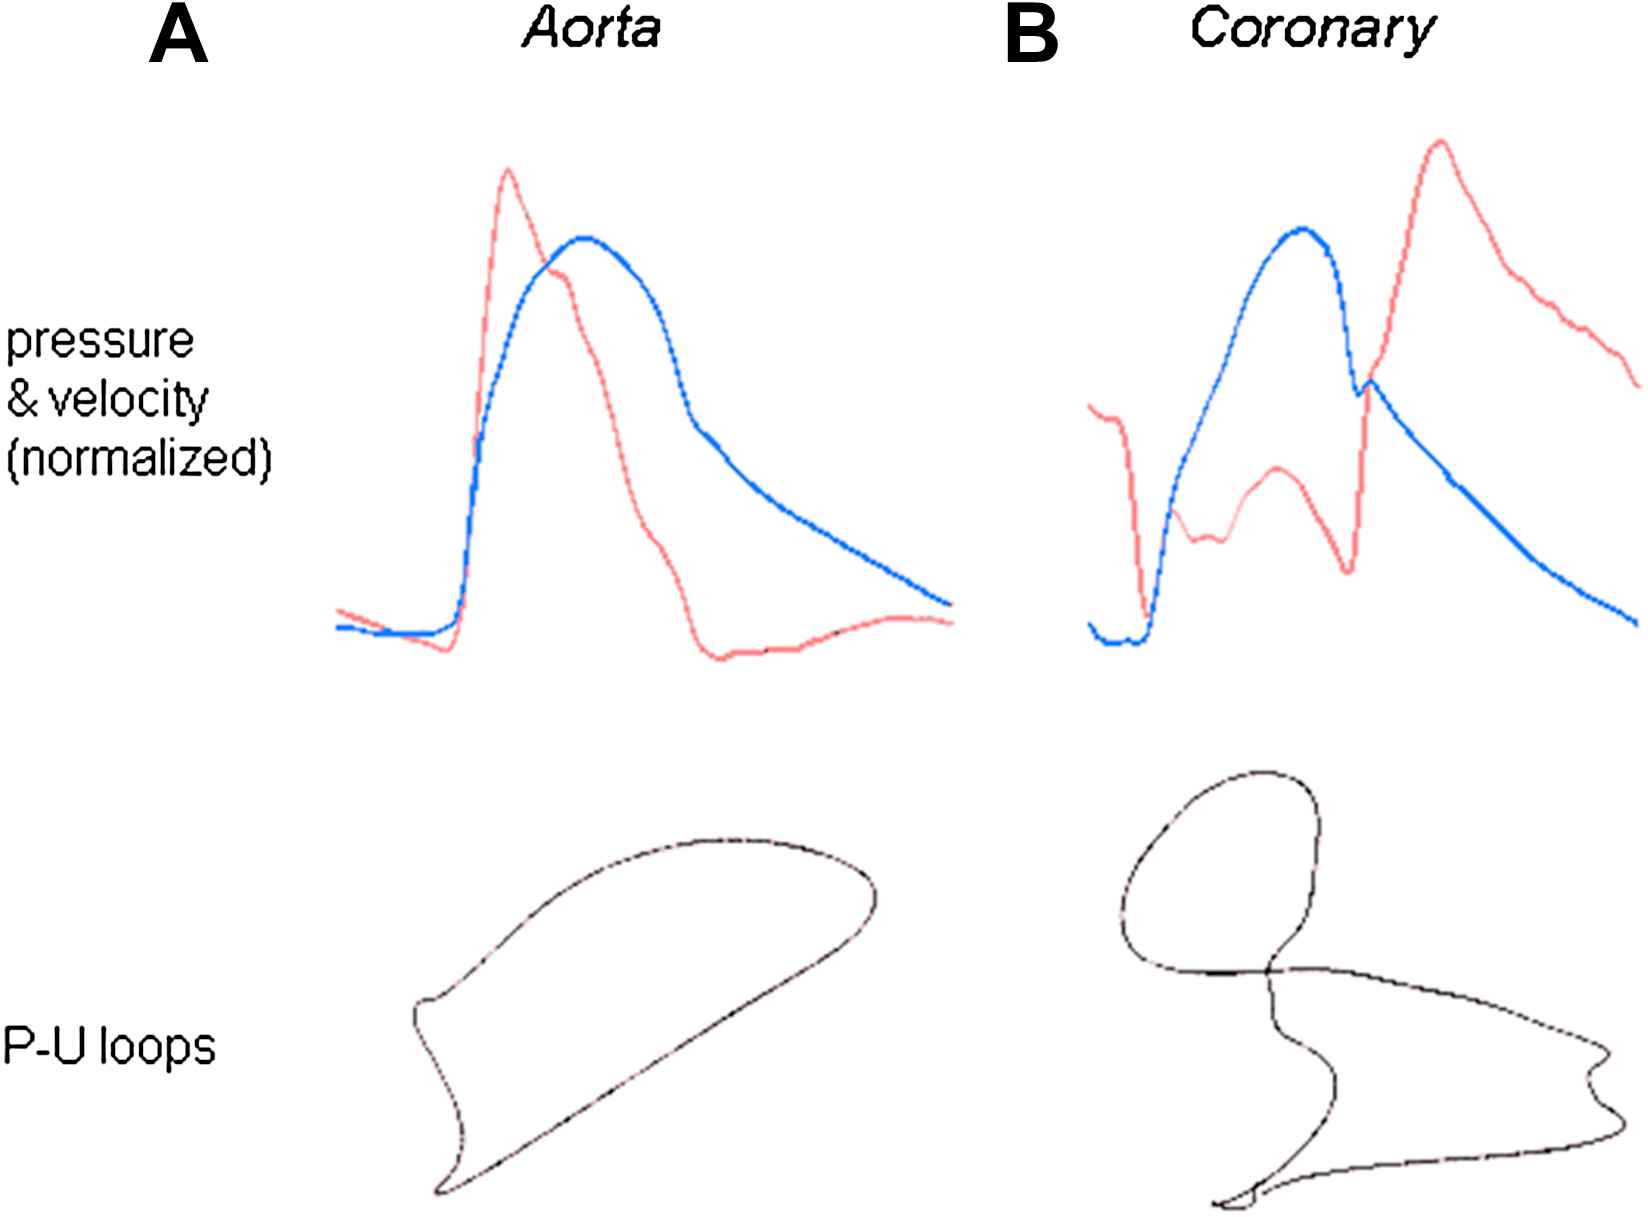
(A) Striking differences between the flow velocity profiles in the proximal aorta and left main stem coronary artery. Pressure (blue) and flow velocity (red) were measured in the proximal aorta (left) and left main stem coronary artery (right) using intra-arterial sensor tip wires. Despite the close proximity of the measurement sites (<5 cm) and the similarity in pressure waveforms, the flow velocity profiles of the aorta and coronary artery are very different. (B) Limited applicability of the pressure–volume loop in the human coronary artery. A plot of pressure vs. velocity is shown (P–U loop). During early systole in the aorta, when wave reflection is negligible, it is possible to determine the local wave speed by measuring the gradient of the slope of the P–U loop. However, in the coronary arteries, it is not possible to determine a linear portion over any part of the cardiac cycle, as flow velocity is influenced by changes in pressure occurring often simultaneously from both the aortic and microcirculatory ends. Thus, the pressure–velocity loop technique cannot be used to calculate wave speed in the human coronary arteries.
It should be noted that the consideration of the coronary circulation up to this point has not distinguished between epicardial and endocardial layers. This is clearly a gross oversimplification. Flow patterns in epicardial and endocardial arterioles differ markedly: subendocardial flow shows striking flow-velocity reversal in systole, while flow velocity is predominantly forward in subepicardial arterioles.72 It has been suggested that retrograde blood flow in systole contributes to the known vulnerability of the subendocardium to ischemia.
It can be seen that the coronary arteries pose unique challenges to the investigator interested in hemodynamics, as both the pressure and flow waveform are influenced by active mechanisms happening at both ends of a relatively short vessel. Wave intensity analysis may offer a solution to some of these problems, as it permits the waves responsible to be unambiguously identified. Waves in the coronary arteries occur concurrently, so separated wave intensity analysis is required. However, this in itself poses additional problems; as discussed above, an estimate of local arterial wave speed (pulse wave velocity) is necessary to separate waves into forward and backward components. In systemic arteries this calculation can be performed by applying the ‘Water Hammer’ equation to pressure and flow readings at a time when no reflected waves are anticipated.73 This approach cannot be relied on in the coronaries as the assumption that there is some period when reflected waves are absent may be invalid. Further, other conventional techniques to estimate wave speed cannot be applied reliably over a short segment of artery (pull back technique). Recently, we described a new technique74 to calculate local wave speed whenever pressure and flow-velocity are known over at least one complete cardiac cycle (Fig. 5). The approach was validated in the aorta against the ‘gold standard’ technique (foot-to-foot) pullback and can in principle be applied to any artery. Using this technique, wave intensity was applied to the human coronary arteries for the first time (Fig. 5).38
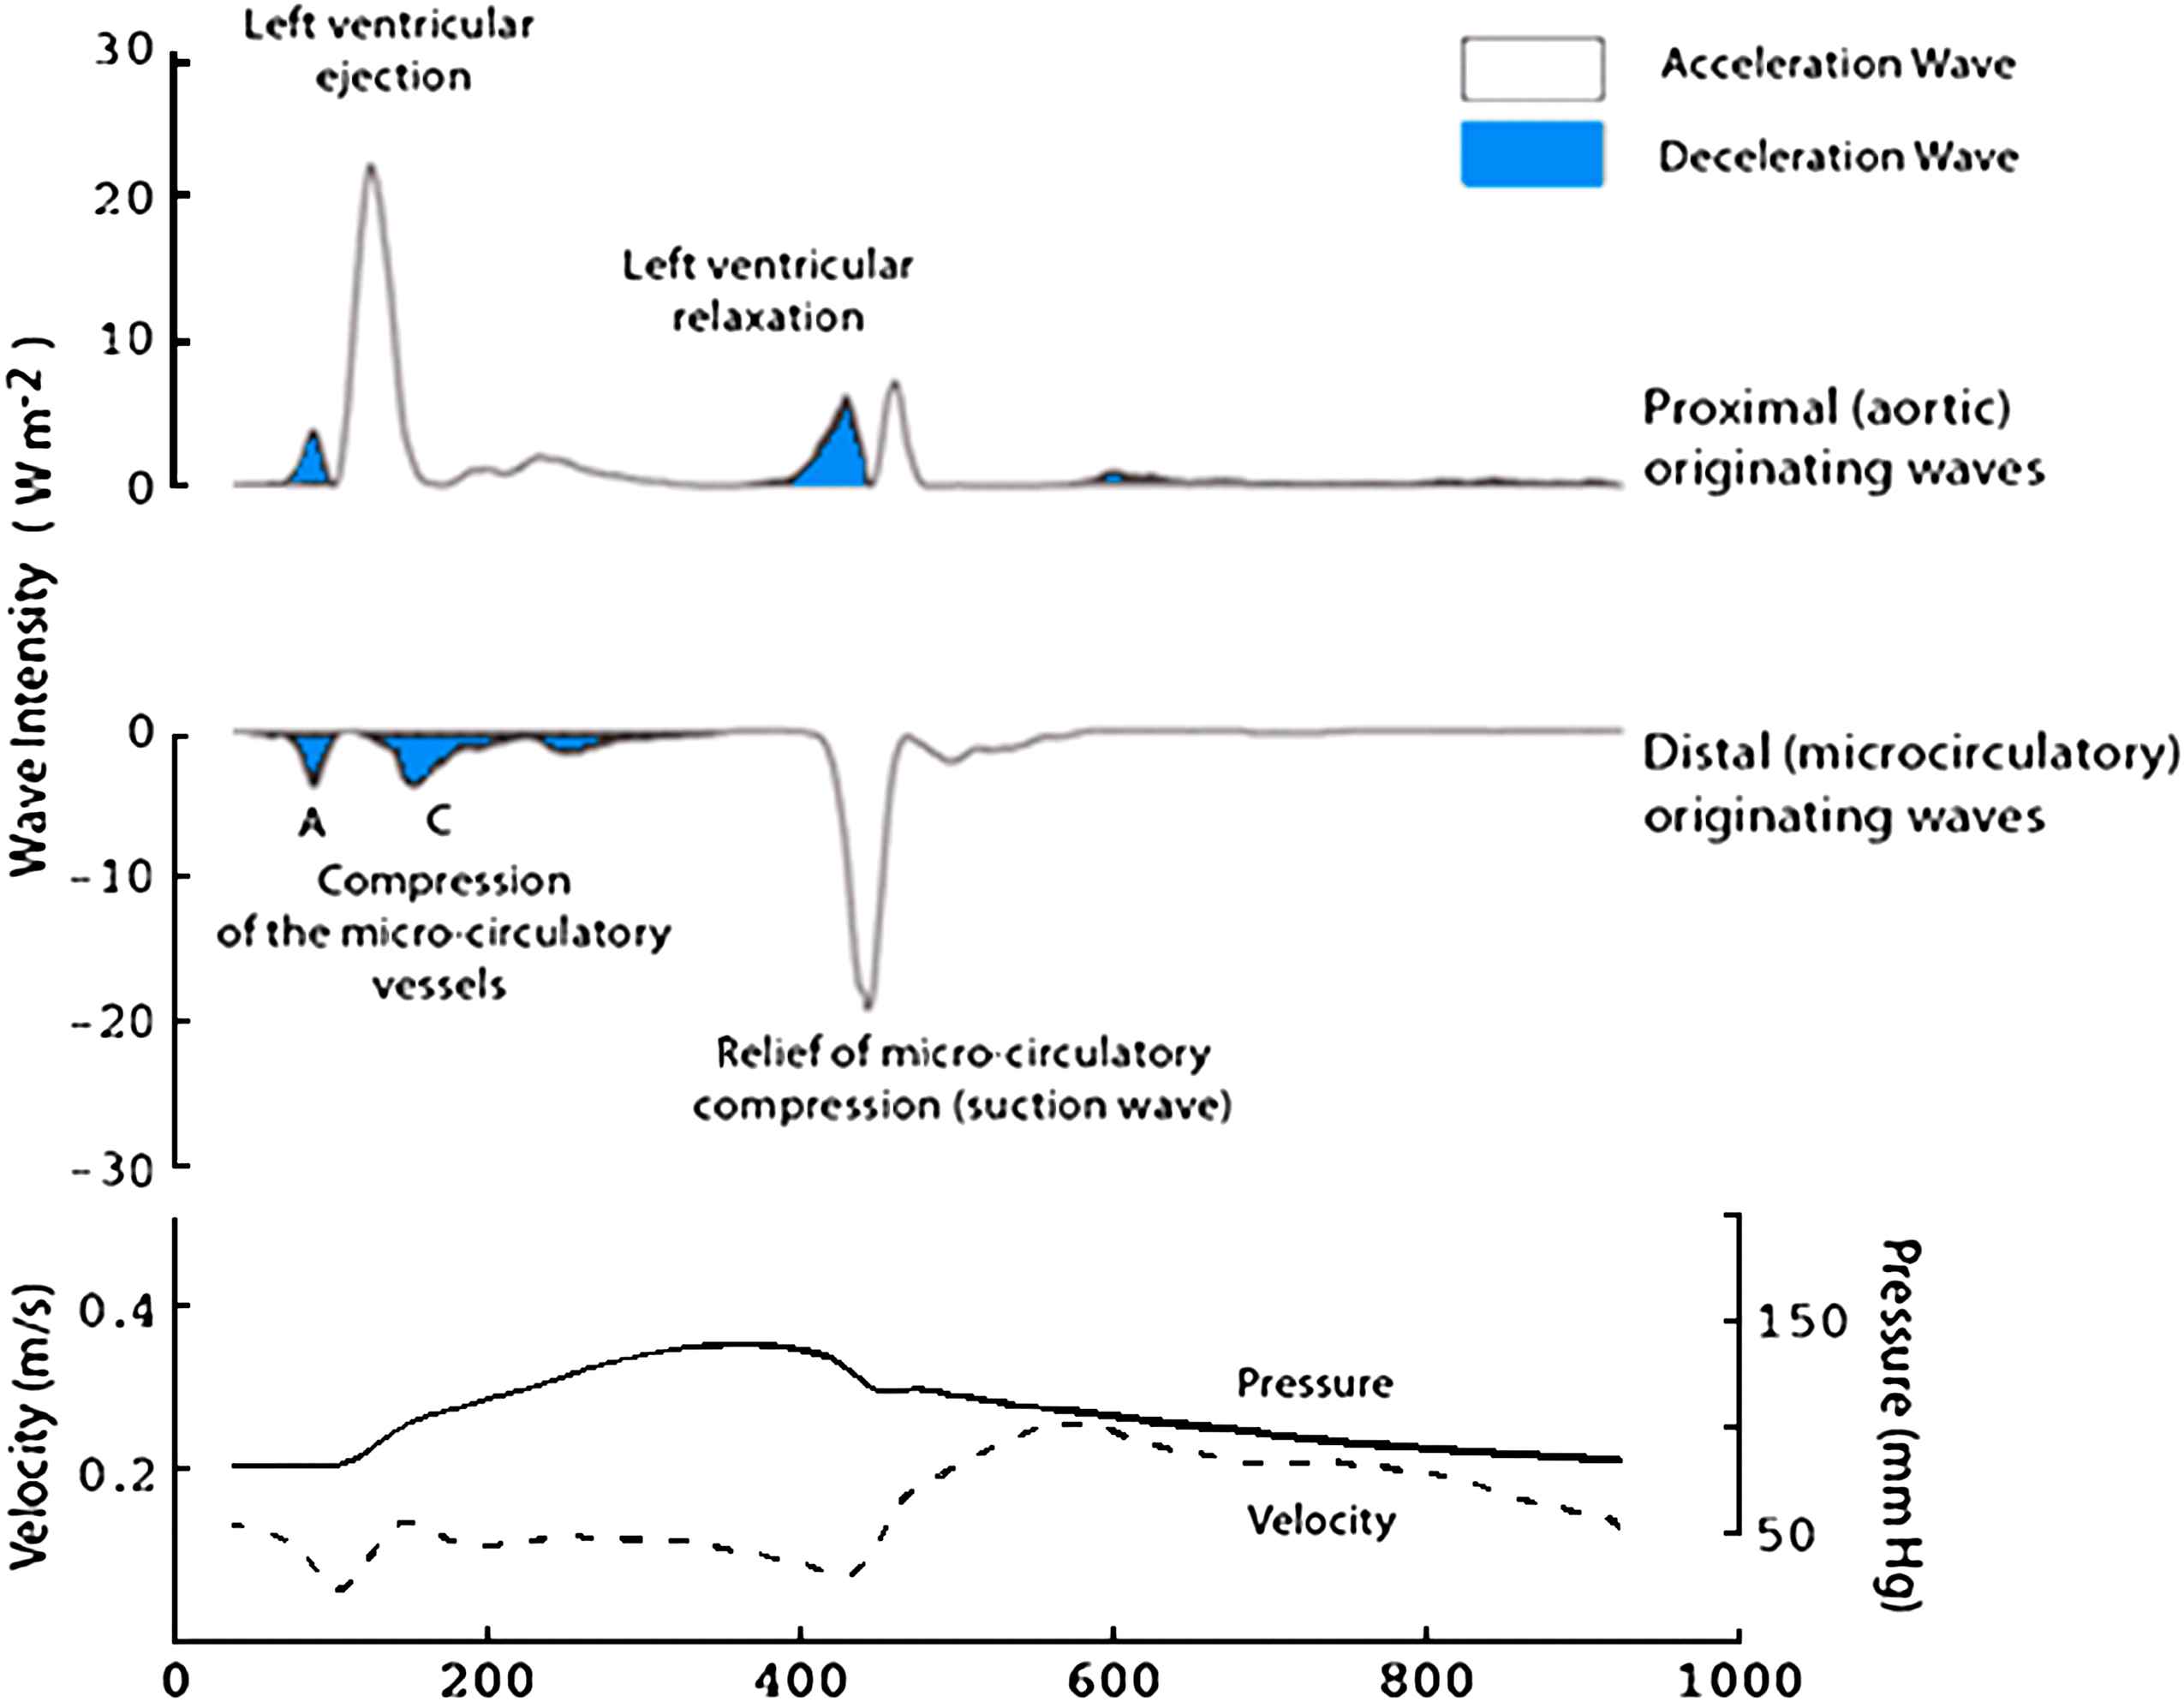
Wave intensity in the human left main stem coronary artery. Wave intensity was calculated in the left main stem coronary artery from simultaneous pressure and velocity measurements acquired using intra-arterial wires (lower panel). Wave intensity is separated into waves originating proximally (upper panel) and waves originating distally (middle panel). In the figure they are colour coded according to the effect they have on blood flow: waves shaded blue decelerate blood flow and unshaded waves accelerate blood flow. One of the key advantages of separated wave intensity is that it can identify waves occurring simultaneously from different directions, which is particularly relevant for waves within the human coronary arteries.
Wave patterns differed markedly from those seen in the aorta and other systemic arteries: six prominent waves were identified in each of the 20 subjects studied. The first wave identified is a backward-travelling compression (pushing) wave that occurs when the microcirculation is compressed by the myocardium during systole (labelled A in Fig. 5). This wave decelerates blood flow velocity in the coronary artery. The next wave to occur is the forward-travelling compression wave (labelled B in Fig. 5). Once the aortic valve opens, aortic pressure and flow velocity increase and the resultant forward-travelling compression wave is conducted into the coronary arteries. This wave causes a transient rise in coronary blood flow as the forward-travelling pushing wave exceeds the backward-travelling pushing wave. Very soon after this the backward-travelling pushing wave is further augmented by addition of reflection of the forward-travelling pushing wave coming back from the distal coronary bed (labelled C in Fig. 5). This reflected wave attenuates coronary blood flow during systole. Once ventricular contraction starts to decelerate a forward-travelling expansion ‘suction’ wave (labelled D in Fig. 5) is generated. This would tend to decelerate coronary blood flow velocity but is simultaneously opposed by a backward-travelling suction wave (labelled E in Fig. 5), originating from the microcirculatory end, which is caused when the compression of the microcirculatory vessels is relieved by myocardial relaxation. Initially these two waves compete like a tug-of-war, both applying a ‘suction’ effect at either end of the vessel, but once the aortic valve closes the backward-travelling suction wave is unopposed leading to the large increase in diastolic coronary blood flow velocity. Forward flow in the coronary arteries is further augmented after closure of the aortic valve as a result of forward-travelling pushing wave (labelled F in Fig. 5).
On the basis of this and previous work in dogs by Tyberg’s group,37,39 we propose that the backward-travelling compression wave in early systole that results in an impediment to coronary flow is caused by compression of the intramural or coronary microcirculatory vessels by the elevated intramyocardial pressure and the contracting ventricular myocardium, as predicted by both the intramyocardial pump and time-varying elastance models.37,39 Work in dogs indicates that this wave is influenced by both changes in coronary resistance and contractility in keeping with the predictions of the intramyocardial pump and time-varying ventricular elastance models.39 The large increase in coronary blood flow during early diastole is attributed to a dominant backward-travelling expansion wave, arising when compression of the microcirculation was relieved. Interestingly, this backward-travelling suction wave was found to be markedly reduced in subjects with left ventricular hypertrophy and we propose that depression of this mechanism of myocardial perfusion could contribute to myocardial ischemia in left ventricular hypertrophy.
Conclusion
Despite its long history, there is still much to be learned about waves in the circulation and the influence of therapy and disease. Wave intensity analysis may be particularly valuable in understanding coronary hemodynamics in pathological circumstances. For example, it may provide novel insights into conditions such as aortic stenosis, no-reflow phenomena and may be useful in the assessment of the viability of myocardial territories. Future development of real-time on-line systems for wave intensity analysis using invasive or non-invasive techniques will doubtless facilitate more widespread clinical application.
Acknowledgements
The authors’ work in this area has been supported by The British Heart Foundation, The Coronary Flow Trust, The Foundation for Circulatory Health and ALOKA.
References
Cite this article
TY  - JOUR
AU  - Alun D. Hughes
AU  - Kim H. Parker
AU  - Justin E. Davies
PY  - 2008
DA  - 2008/04/02
TI  - Waves in arteries: A review of wave intensity analysis in the systemic and coronary circulations
JO  - Artery Research
SP  - 51
EP  - 59
VL  - 2
IS  - 2
SN  - 1876-4401
UR  - https://doi.org/10.1016/j.artres.2008.02.002
DO  - 10.1016/j.artres.2008.02.002
ID  - Hughes2008
ER  -