
Detection of aortic wall inclusions using regional pulse wave propagation and velocity in silico
- DOI
- 10.1016/j.artres.2012.05.004How to use a DOI?
- Keywords
- Aortic pulse wave velocity (PWV); Aortic wall stiffness; Regional stiffening; Regional softening; Pulse wave imaging (PWI)
- Abstract
Monitoring of the regional stiffening of the arterial wall may prove important in the diagnosis of various vascular pathologies. The pulse wave velocity (PWV) along the aortic wall has been shown to be dependent on the wall stiffness and has played a fundamental role in a range of diagnostic methods. Conventional clinical methods entail global examination of the pulse traveling between two remote sites, e.g. femoral and carotid arteries, to provide an average PWV estimate. However, the majority of vascular diseases entail regional vascular changes and therefore may not be detected by a global PWV estimate. In this paper, a fluid-structure interaction study of straight-geometry aortas of 350 mm length is described aimed at examining the effects of regional stiffness changes on the PWV. Five homogeneous aortas with increasing wall stiffness as well as two aortas with soft and hard inclusions of 5 mm length were considered. In each case, spatio-temporal maps of the wall motion were used to analyze the regional pulse wave propagation. On the homogeneous aortas, increasing PWVs were found to increase with the wall moduli (R2 = 0.9988), indicating the reliability of the model to accurately represent the wave propagation. On the inhomogeneous aortas, formation of reflected and standing waves was observed at the site of the hard and soft inclusions, respectively. Neither the hard nor the soft inclusion had a significant effect on the velocity of the traveling pulse beyond the inclusion site, which supported the hypothesis that a global measurement of the average PWV could fail to detect small, regional abnormalities.
- Copyright
- © 2012 Association for Research into Arterial Structure and Physiology. Published by Elsevier B.V. All rights reserved.
- Open Access
- This is an open access article distributed under the CC BY-NC license.
Introduction
Changes in the vascular mechanical properties may have immediate ramifications on the onset and progression of cardiovascular diseases (CVD) such as the increase of the systolic blood pressure due to arterial wall stiffening.1 Increase in the aortic stiffness has been reported in different studies as an independent indicator of all-cause and CVD-related mortalities such as those related to primary coronary events and fatal stroke in hypertensive patients,2,3 cardiovascular risks related to diabetes,4,5 vascular calcification6,7 and aortic aneurysms (for which both wall stiffening and softening have been reported).8–14 Collectively, there has been a consensus that assessing arterial stiffness should be part of the routine clinical diagnosis, treatment and follow-up procedures.15,16
Methods for measuring arterial stiffness typically fall into two broad categories. The first set of methods includes those based on radial pulsation such as diameter-pressure measurements. A major drawback in using these methods is the requirement for the central pressure measurement, which is either invasive, e.g., through catheterization17 or incurs large degrees of inaccuracy using empirical transfer functions of peripheral pressure data, e.g., tonometry.18 The next set of methods includes those based on measuring the velocity of the longitudinal aortic pulse wave. The pulse wave velocity (PWV) has been shown to be related to the underlying tissue stiffness through the Moens–Korteweg equation19,20 and has been used in a variety of applications.21–23 The quantitative stiffness measurements based on the Moens–Korteweg relationship could be inaccurate in applications –such as the present study– where certain underlying assumptions, e.g. infinitely long and thin-walled cylinder, are not met.17,23 However, the qualitative relationship between stiffness and PWV remains valid and forms the basis of the PWI method for detection of regional changes in stiffness based on the PWV measurements.
Different methods have been proposed for the noninvasive estimation of PWV.24,25 The current gold standard in clinical practice is to obtain the global PWV by measuring the temporal pulse pressure profiles at two remote sites, typically the carotid and femoral arteries.16,26 The time delay between the two ECG-synchronized waveforms (Δt) is estimated27 and divided by the distance (D) between the two sites, obtained by over-the-skin measurements, in order to estimate the global PWV through PWV = D/Δt. Such methods are at the core of most clinical studies involving the measurement of arterial stiffness.28–30 However, there are drawbacks associated with the global PWV measurement which can largely impair the accuracy of the method. For instance, the lack of knowledge of the exact arterial geometry as well as the assumption of a single longitudinal flow direction between the carotid and the femoral arteries may lead to erroneous estimation of the true distance.31 More importantly, the wall stiffness and PWV have been shown to vary locally along the arterial wall.17,32 Therefore, the use of a global PWV may not detect the early onset or focal disease such as an aneurysm.32–34 These and other fundamental limitations of these methods have been reviewed in detail elsewhere.35
Imaging modalities such as ultrasound36–45 and MRI46–50 have been used for noninvasive imaging of the arterial wall at multiple time-points during the cardiac cycle in order to track the propagation of the transient vibrations along the arterial wall in 2D and estimate the PWV; in some cases, along with simultaneous pressure measurements for measuring parameters such as the augmentation index. More recently, the ultrasound-based method of Pulse Wave Imaging (PWI) has been developed to fully map and analyze the wave propagation with high temporal and spatial resolutions and to measure the local PWV. The PWI method has been applied in normal and aneurysmal mouse aortas in vivo14,51 as well as normal and aneurysmal human aortas,52–54 aneurysmal and hypertensive subjects,55 and experimental phantoms,31 and has also been compared against applanation tonometry in humans.56 However, the reliability of PWI in estimating regional PWV needs to be verified in the presence of discontinuities at the sites of regional change in wall composition and geometry such as arterial branches and aneurysmal lesions to better determine its clinical potential.
Modeling of the aortic pulsation can therefore provide additional insight into the pulse wave characteristics in arteries with irregular geometry and abnormal wall properties, and the results can be used as a guideline for in vivo animal and clinical examinations. Finite-element methods (FEM) used to model cardiovascular biomechanics primarily rely on solid-state (SS) modeling of blood vessels experiencing static or pulsatile internal pressure replicating the hemodynamic effects.57,58 More recently, fully-coupled fluid-structure interaction (FSI) simulations using patient-specific geometries and anisotropic finite-strain constitutive relations have been reported in healthy and diseased arteries,57,59–62 aiming at computing parameters such as fluid velocity and pressure as well as wall strain and stress.63,64 Scotti et al. have extracted temporal information on the arterial wall displacement during dynamic FSI; however, no spatial information was obtained and thus no PWV measurements could be performed.65 Preliminary studies on developing finite-element models of aortic pulse wave propagation have been reported by our group.66 In particular, applying Coupled Eulerian-Lagragian (CEL) analysis for simulation of arterial pulse wave propagation has previously been validated against phantom and in vitro canine studies.67–69
In this paper, we develop a fully dynamic FSI model of a traveling pulse wave in straight-geometry aortas of homogenous and inhomogeneous (inclusion) models in order to obtain the regional PWV estimates. Spatio-temporal maps of the wall motion will be used to calculate the regional PWVs on the homogenous and on the inclusion models to better understand the effects of focal changes on the regional and global PWVs.
Methods
Numerical modeling
A full 3D dynamic FSI model of pulse wave propagation was constructed in Coupled Eulerian-Lagrangian (CEL) explicit solver of Abaqus 6.10-1 (Simulia, RI, USA). A workstation with Intel® Xeon® CPU @2.33 GHz and 32 GB RAM was used to perform the computations. The aortic wall was modeled as a purely elastic material: Young’s modulus of E = 2.56–7.68 MPa, density ρs = 1050 kg/m3, Poisson’s ratio ν = 0.48.65,70,71 In order to follow the configurations used in our previously reported phantom and in vitro studies,54,67–69 fluid was assumed to be Newtonian, with material properties as follows: density ρf = 1000 kg/m3, reference sound speed c0 = 1483 m/s and viscosity η = 0.0001 Ns/m2.72,73 The Lagrangian part was constructed as a straight cylindrical geometry (ri = 12 mm; t = 2.2 mm), encompassed by the Eulerian domain simulating the presence of a fluid medium. A total of seven modeling parameters were considered: five with homogenous walls of distinct stiffness (Fig. 1a) and two with inhomogeneous walls containing hard or soft inclusions (Fig. 1b), respectively. The normal homogenous model was assumed to have a Young’s modulus equal to E1 = 2.56 MPa.10 To simulate early onset of diseases such as atherosclerosis or aneurysm,7,10 four other homogenous models were constructed with Young’s moduli of E2 = 1.5E1 = 3.84 MPa, E3 = 2E1 = 5.12 MPa, E4 = 2.5E1 = 6.40 MPa and E5 = 3E1 = 7.68 MPa, respectively. For the models with an inclusion, the same geometry was used but with an inclusion of axial length 5 mm, located at 90 mm from vessel inlet (Fig. 1b). A Young’s modulus of Ehard−incl = 7.68 MPa and Esoft−incl = 2.56 MPa was used to represent the hard and soft inclusions on the E1 = 2.56 MPa and E5 = 7.68 MPa models, respectively. In all models, both the inlet and outlet were fully constrained in x-y-z dimensions. A rectangular function with magnitude V0 = 5 m/s was set as the initial velocity on the tube inlet which served as the driving force at the FSI and caused the dynamic wall motion. A frictionless fluid-structure interface was defined between the wall and the medium. Both the Eulerian and Lagrangian domains were meshed using same-size linear hexagonal 3D elements to increase the FSI mesh consistency. A mesh seeding topology was designed to generate a minimum of three layers of elements across the wall thickness and a seeding size of 4 mm was found to be optimal in providing a converging solution while computationally affordable. The model contained a total number of 17688 elements and 21780 nodes. The initial time increment was 9.57E-07 s where the average stable time increment changed between 2.70E-06 and 4.29E-06 s across the 7 models. The radial displacement of the entire wall along the tube (axial spatial resolution of 5 mm) was measured on multiple time-points (temporal resolution of 0.375 ms) (Fig. 2) and the information was mapped onto a 2D spatio-temporal plane which allowed the visualization of the entire wave propagation and tracking of the wave peak. Unlike in the experimental phantom and in vivo studies where the wave foot has been reported to be more robust for tracking the wave than the peak,51,55 in the current simulations, the wave peak was found to be as robust and a better marker for tracking the traveling wave. The PWV was calculated as the slope of the linear regression fit to the wave peak locations versus time.
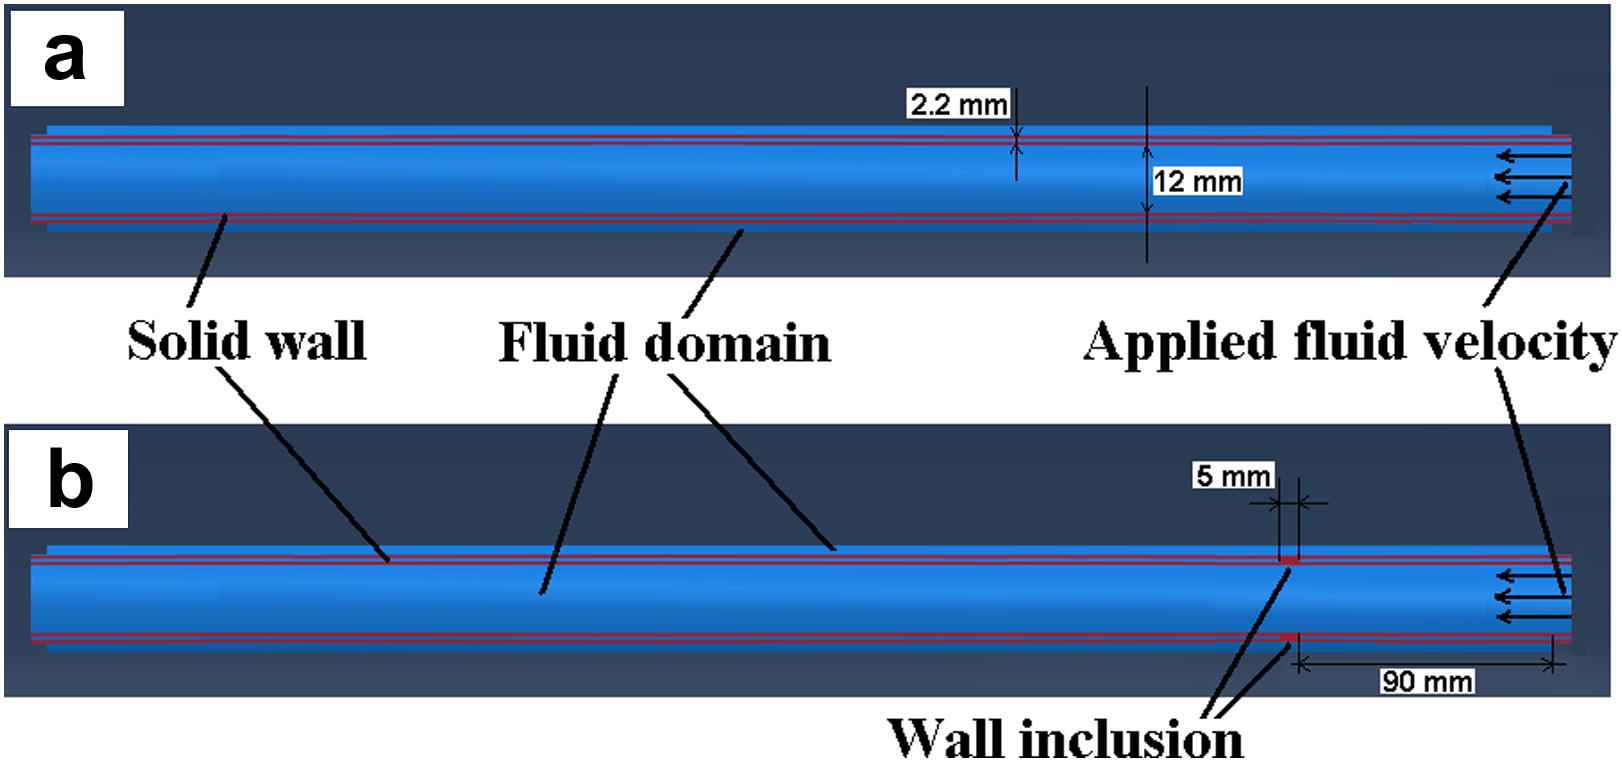
Longitudinal cross-section of the aorta-fluid geometry in Abaqus: (a) Homogenous model, (b) Inclusion model.
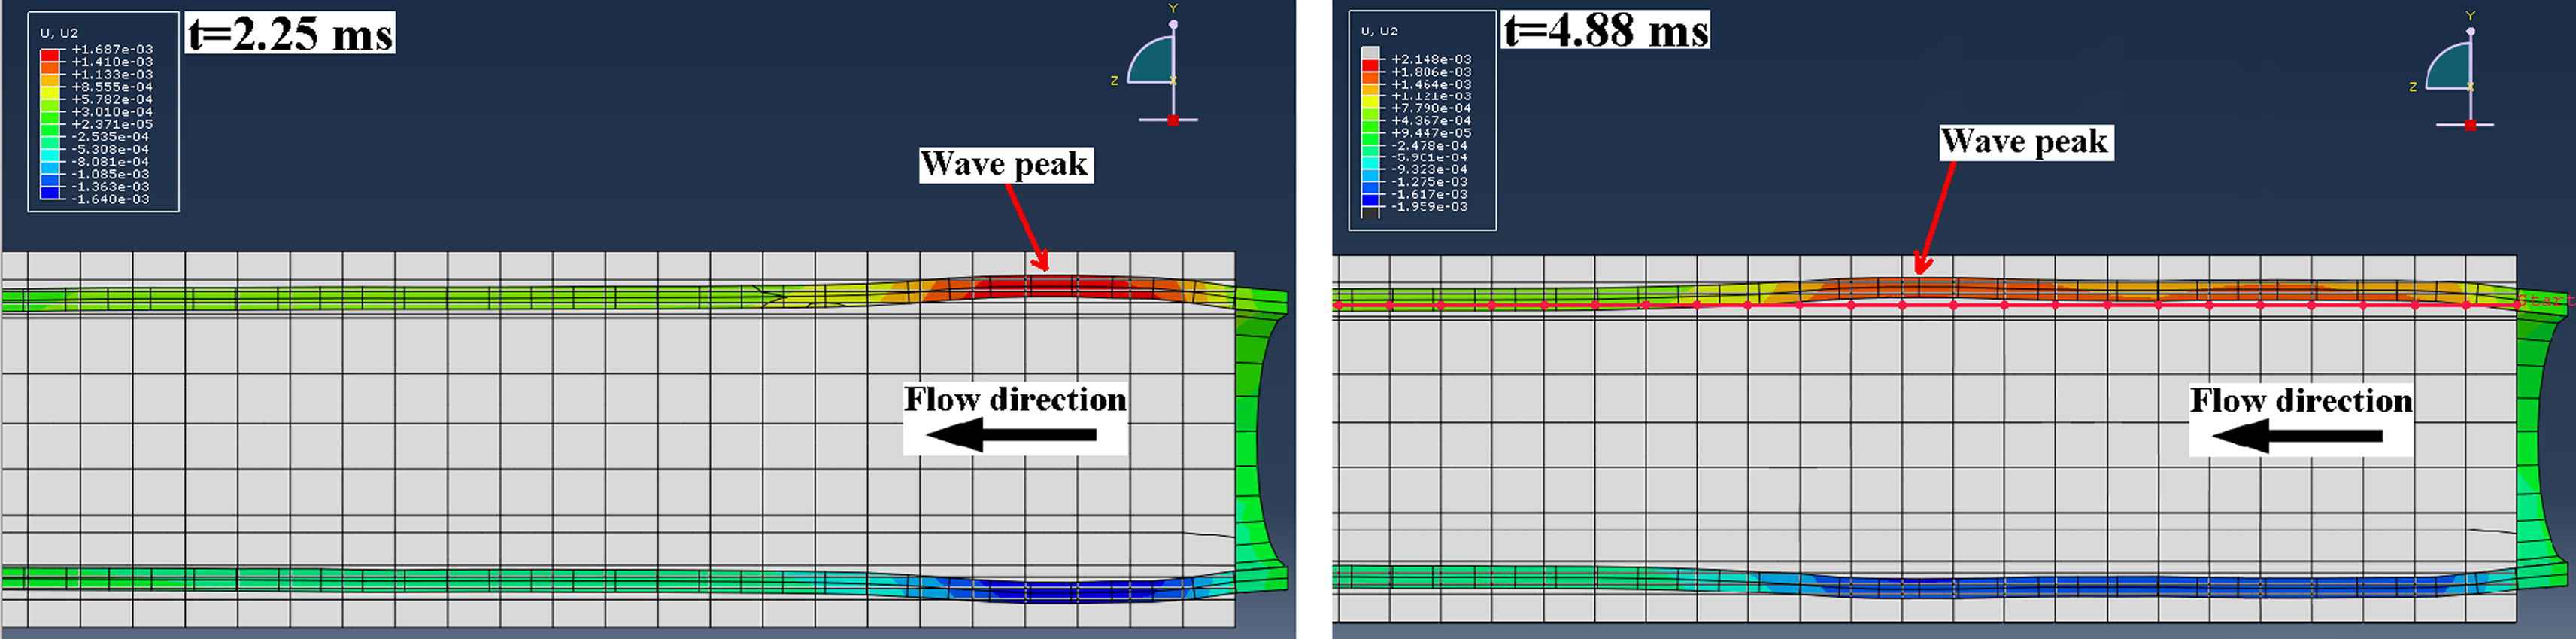
Examples of two temporal frames of the pulse-wave-induced wall displacement in the homogenous model showing the forward traveling wave.
PWV-based regional stiffness detection
The spatio-temporal maps were used to analyze the pulse wave propagation both qualitatively (e.g. detecting different forward and reflected waves) and quantitatively (e.g. computing the PWV on each wave). Both qualitative and quantitative measures were used to monitor the wall stiffness and its regional changes. The PWV can be used to estimate the Young’s modulus, E, via the modified Moens–Korteweg equation17,19,20:
Results
Homogenous walls
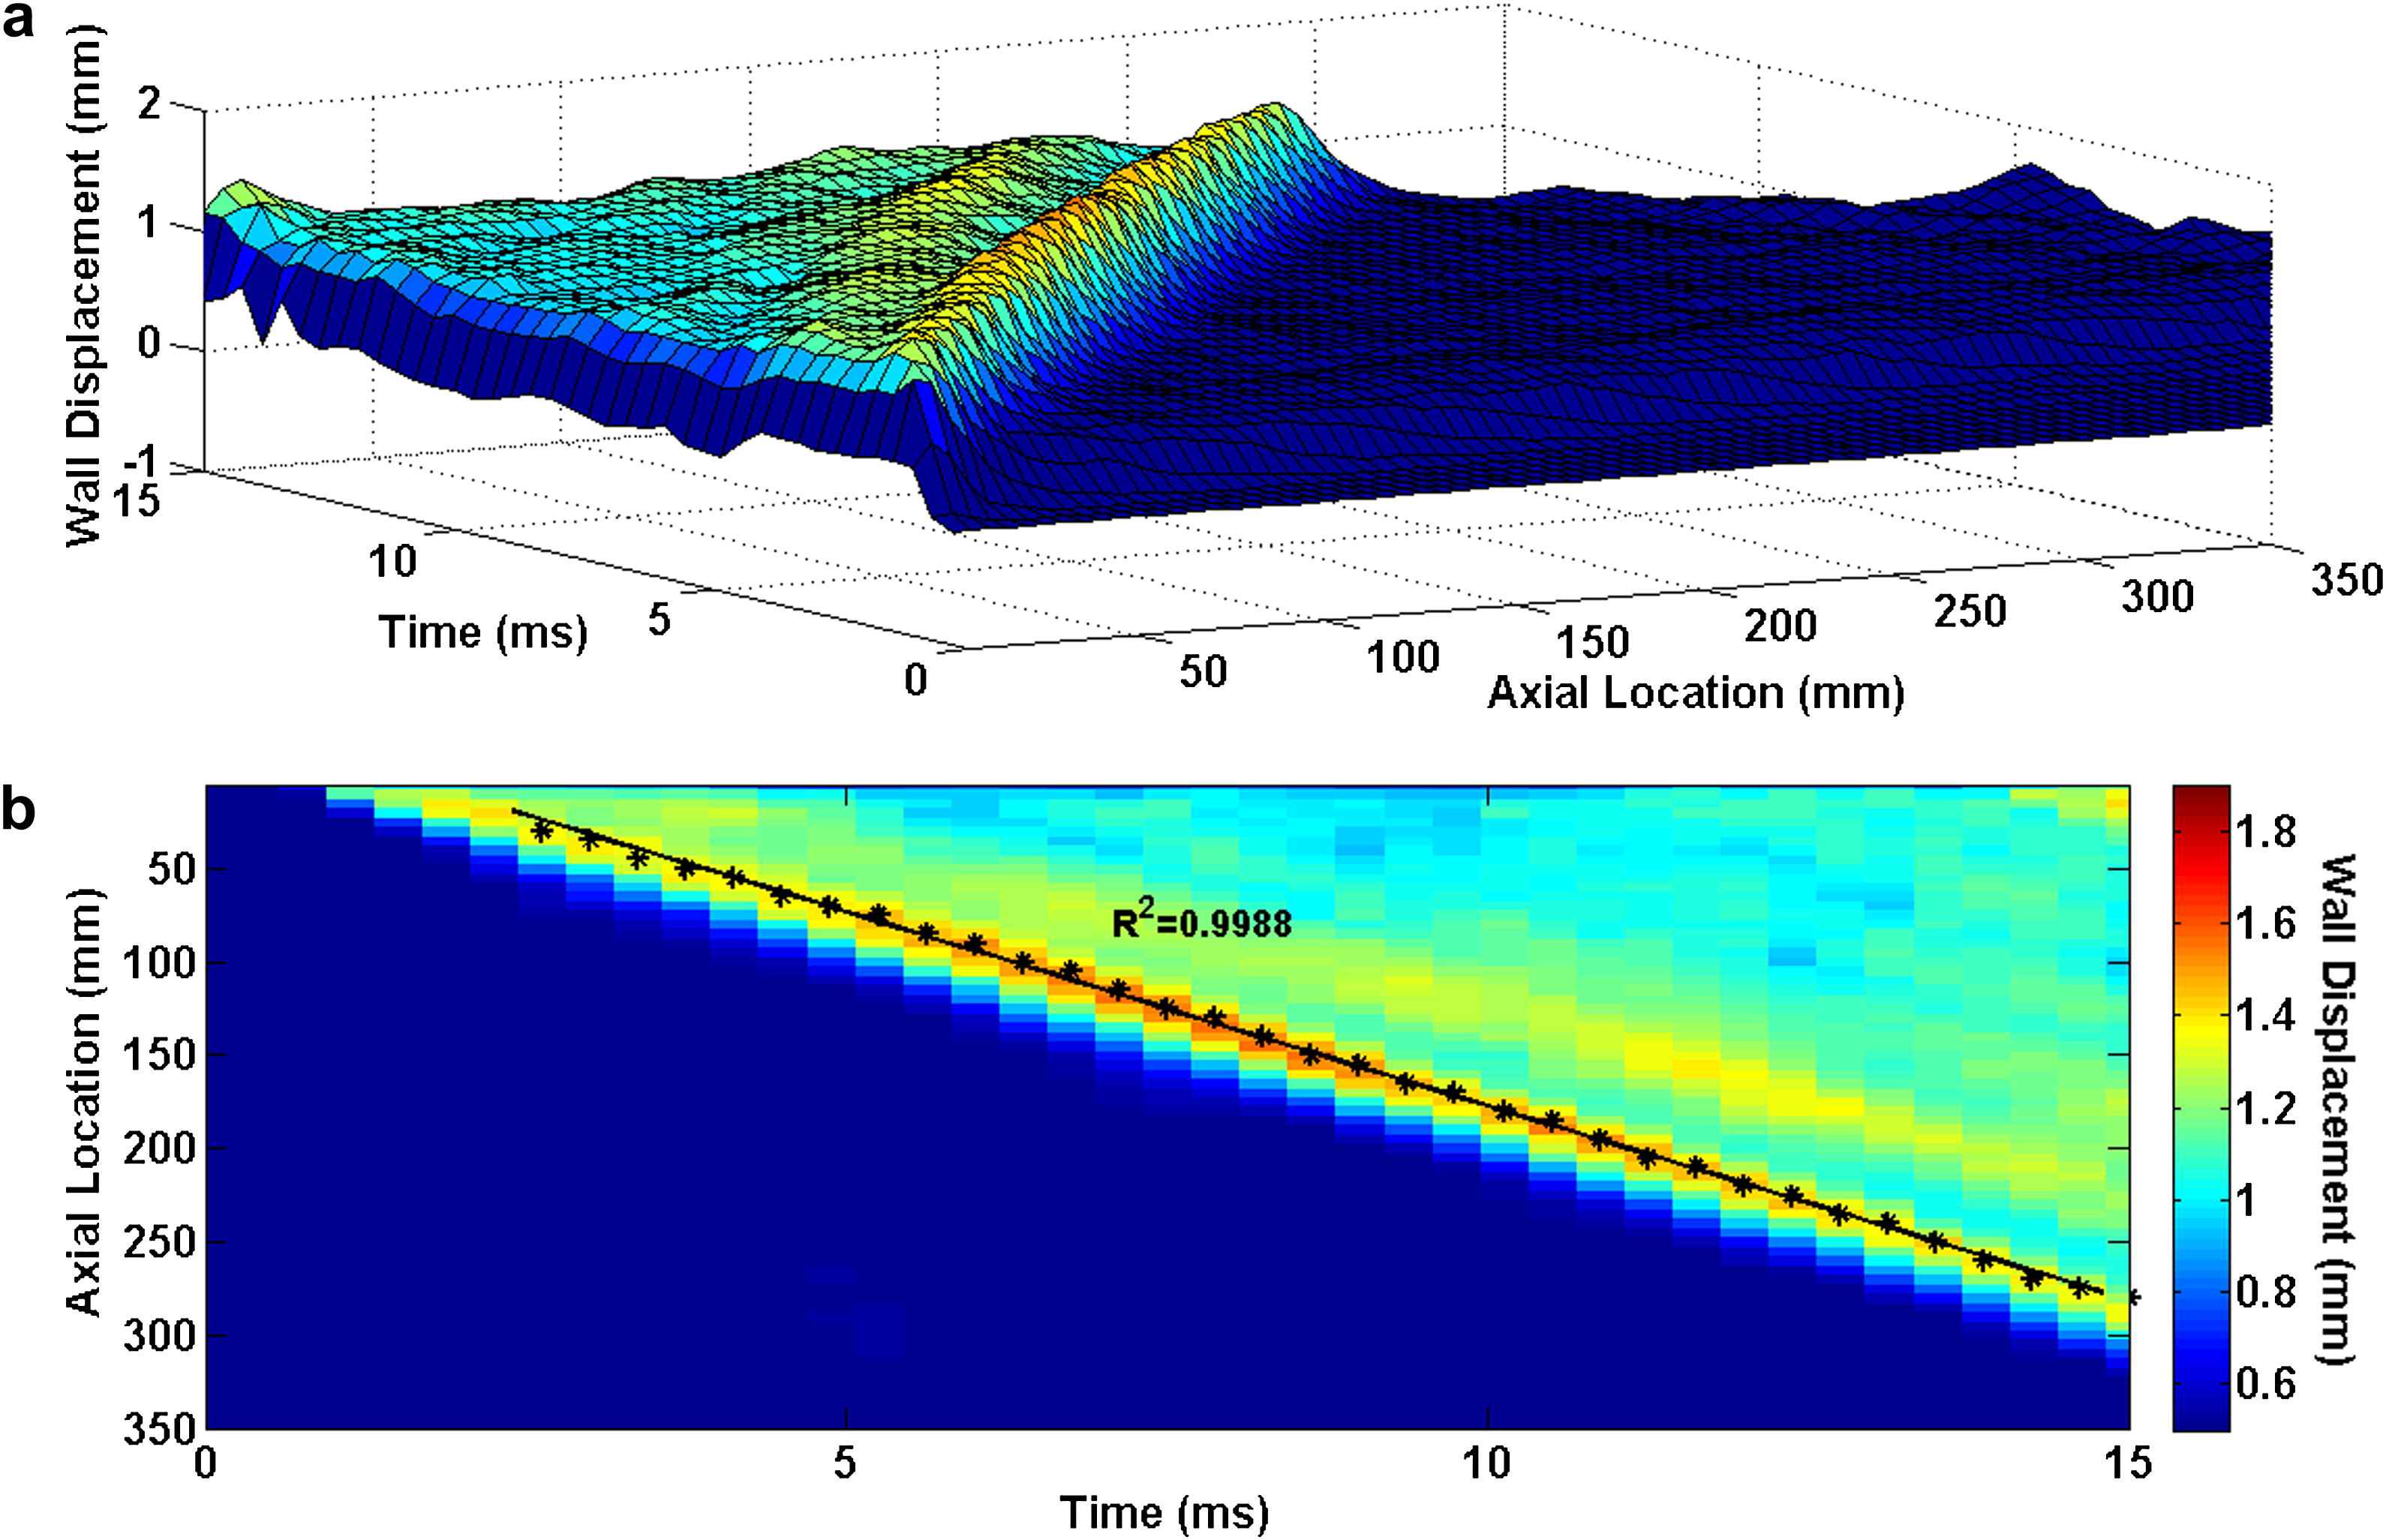
Figs. 3–5 illustrate the 3D waterfall plots as well as the corresponding 2D spatio-temporal maps of the wall motion, obtained from the three homogenous models with Young’s modulus of E1 = 2.56 MPa, E3 = 5.12 MPa and E5 = 7.68 MPa, respectively, showing the PWV to increase with the wall stiffness. For all five homogenous models, the linear regression fit to the wave peaks yields the following velocities: PWV1 = 12.59 m/s (R2 = 0.9981), PWV2 = 15.25 m/s (R2 = 0.9983), PWV3 = 17.45 m/s (R2 = 0.9991), PWV4 = 19.15 m/s (R2 = 0.9986) and PWV5 = 20.81 m/s (R2 = 0.9988) on the models with modulus E1 through E5, respectively.
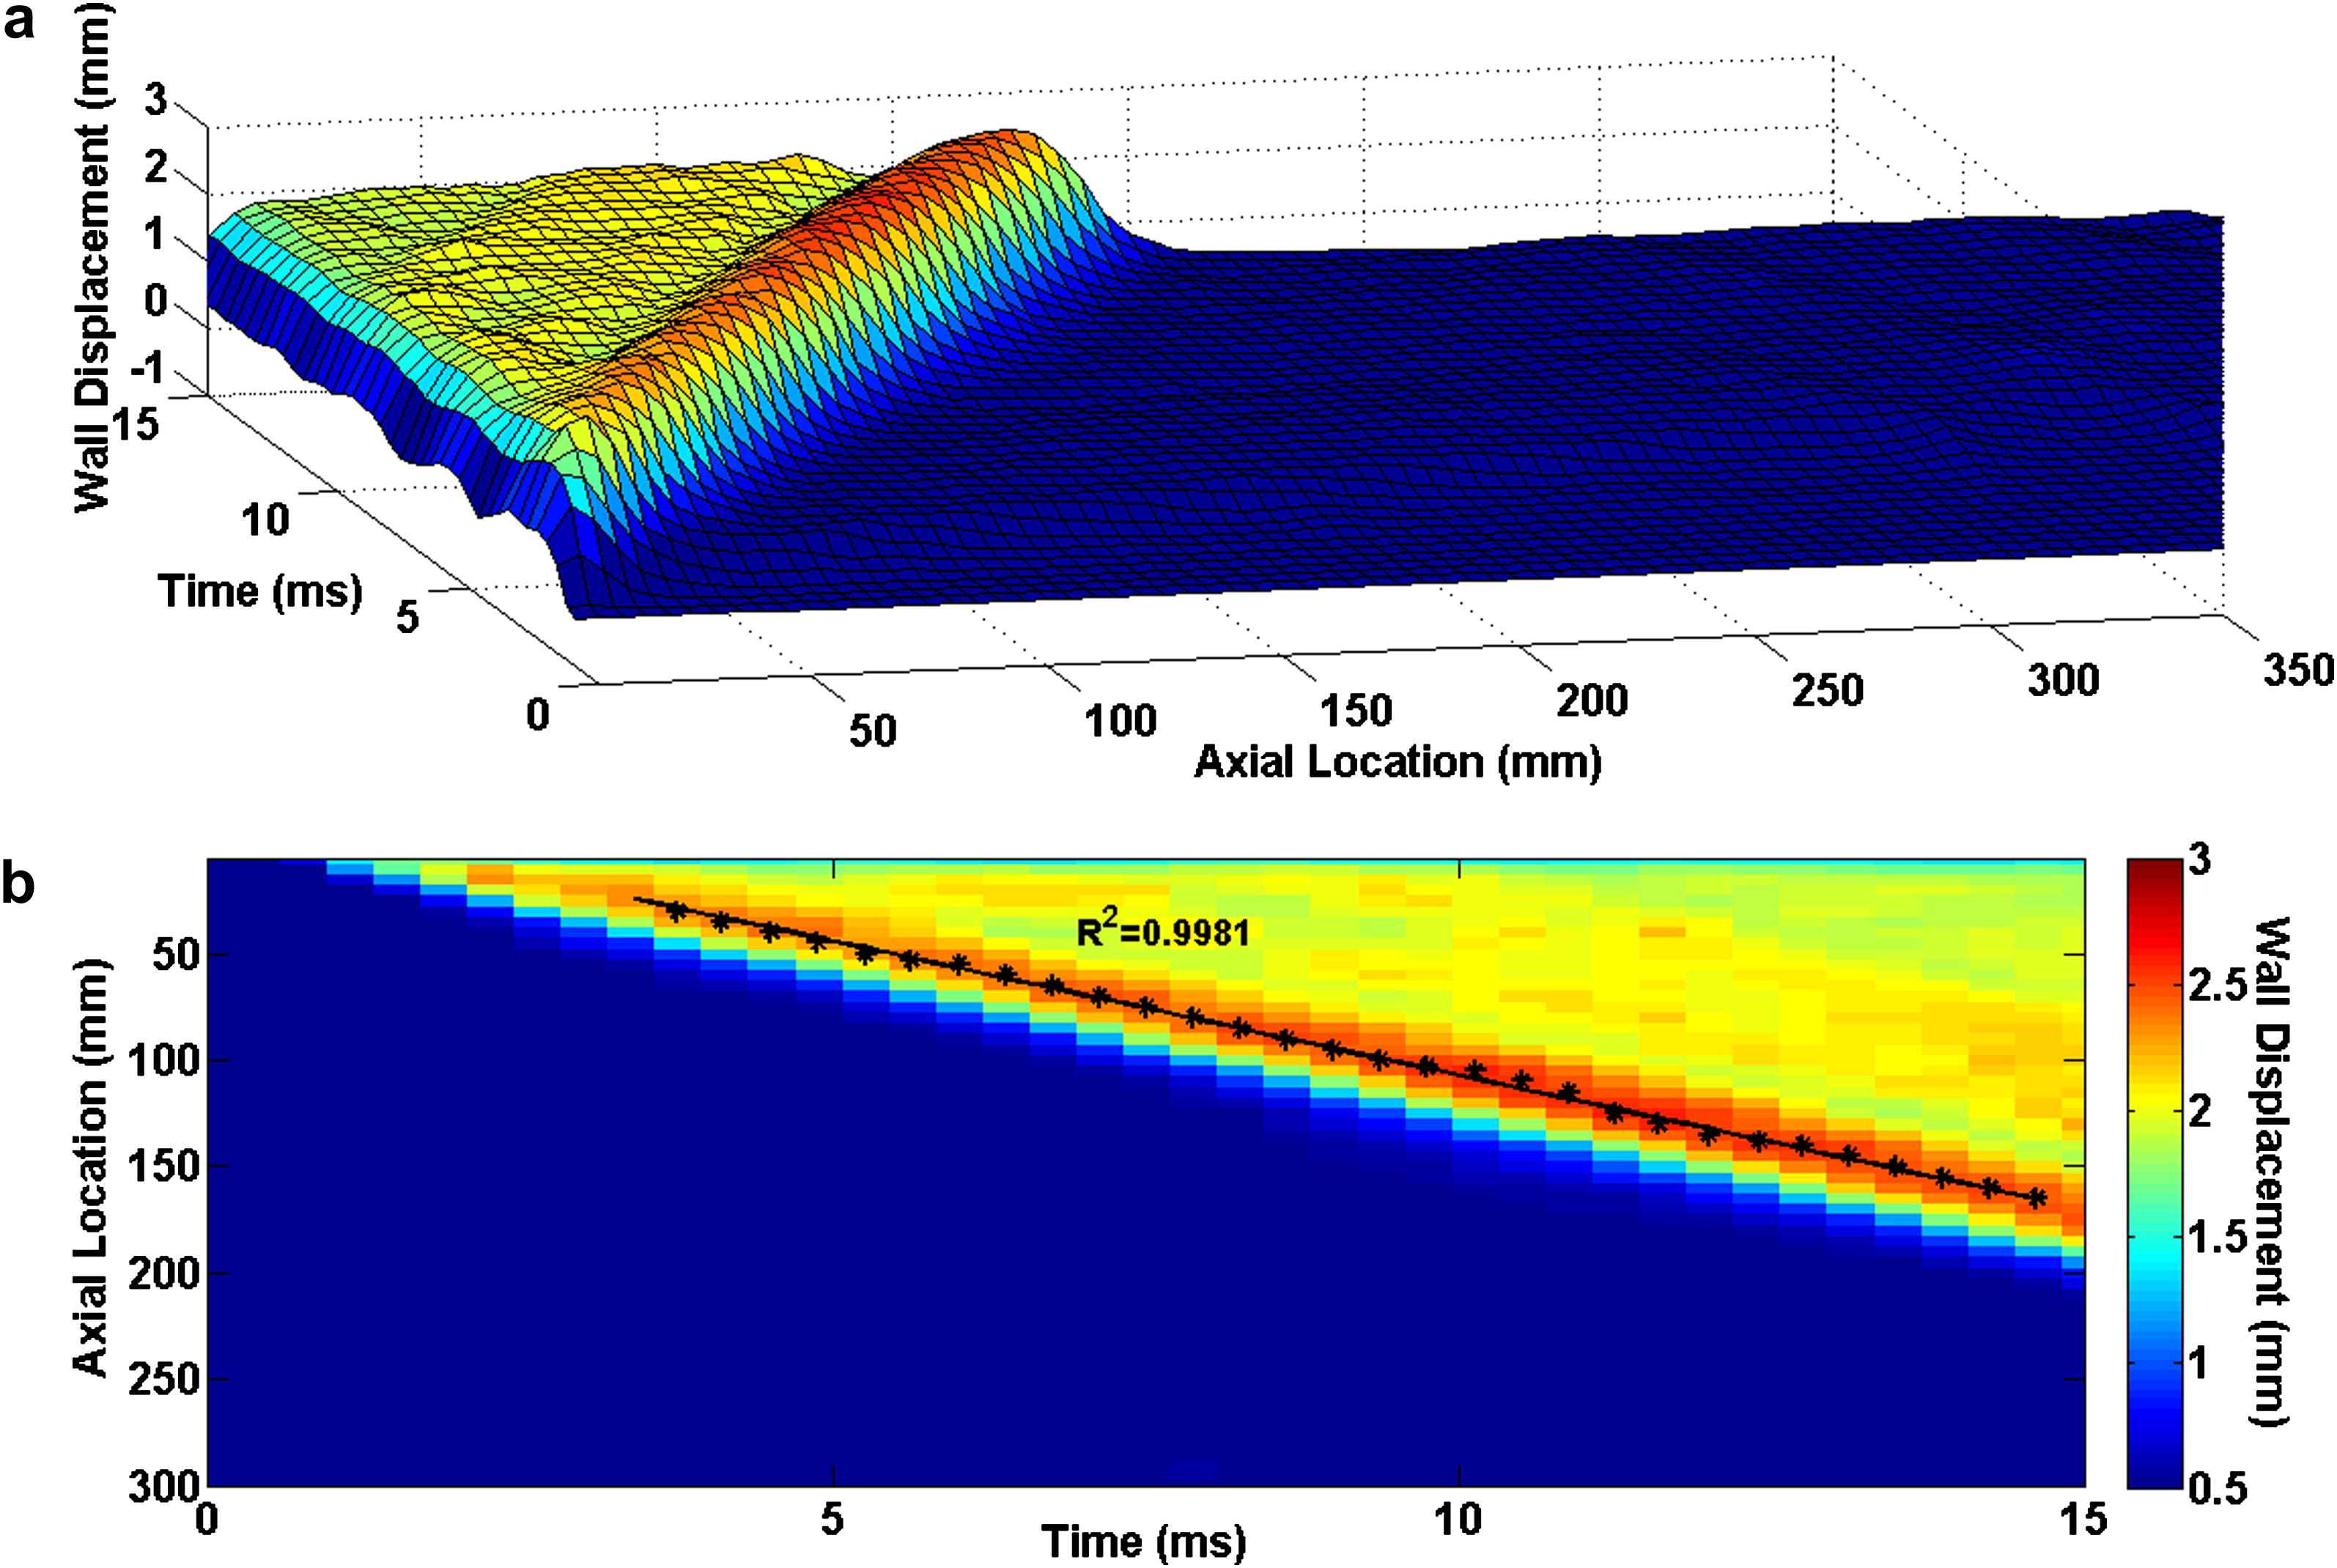
Homogenous model with Young’s modulus of E1 = 2.56 MPa: (a) Waterfall plots of the wall displacement against temporal and spatial coordinates on the aortic wall. (b) 2D spatio-temporal plot of the wall displacement. Also shown are the peaks (black asterisks) on the forward wave and the regression fit (black line).
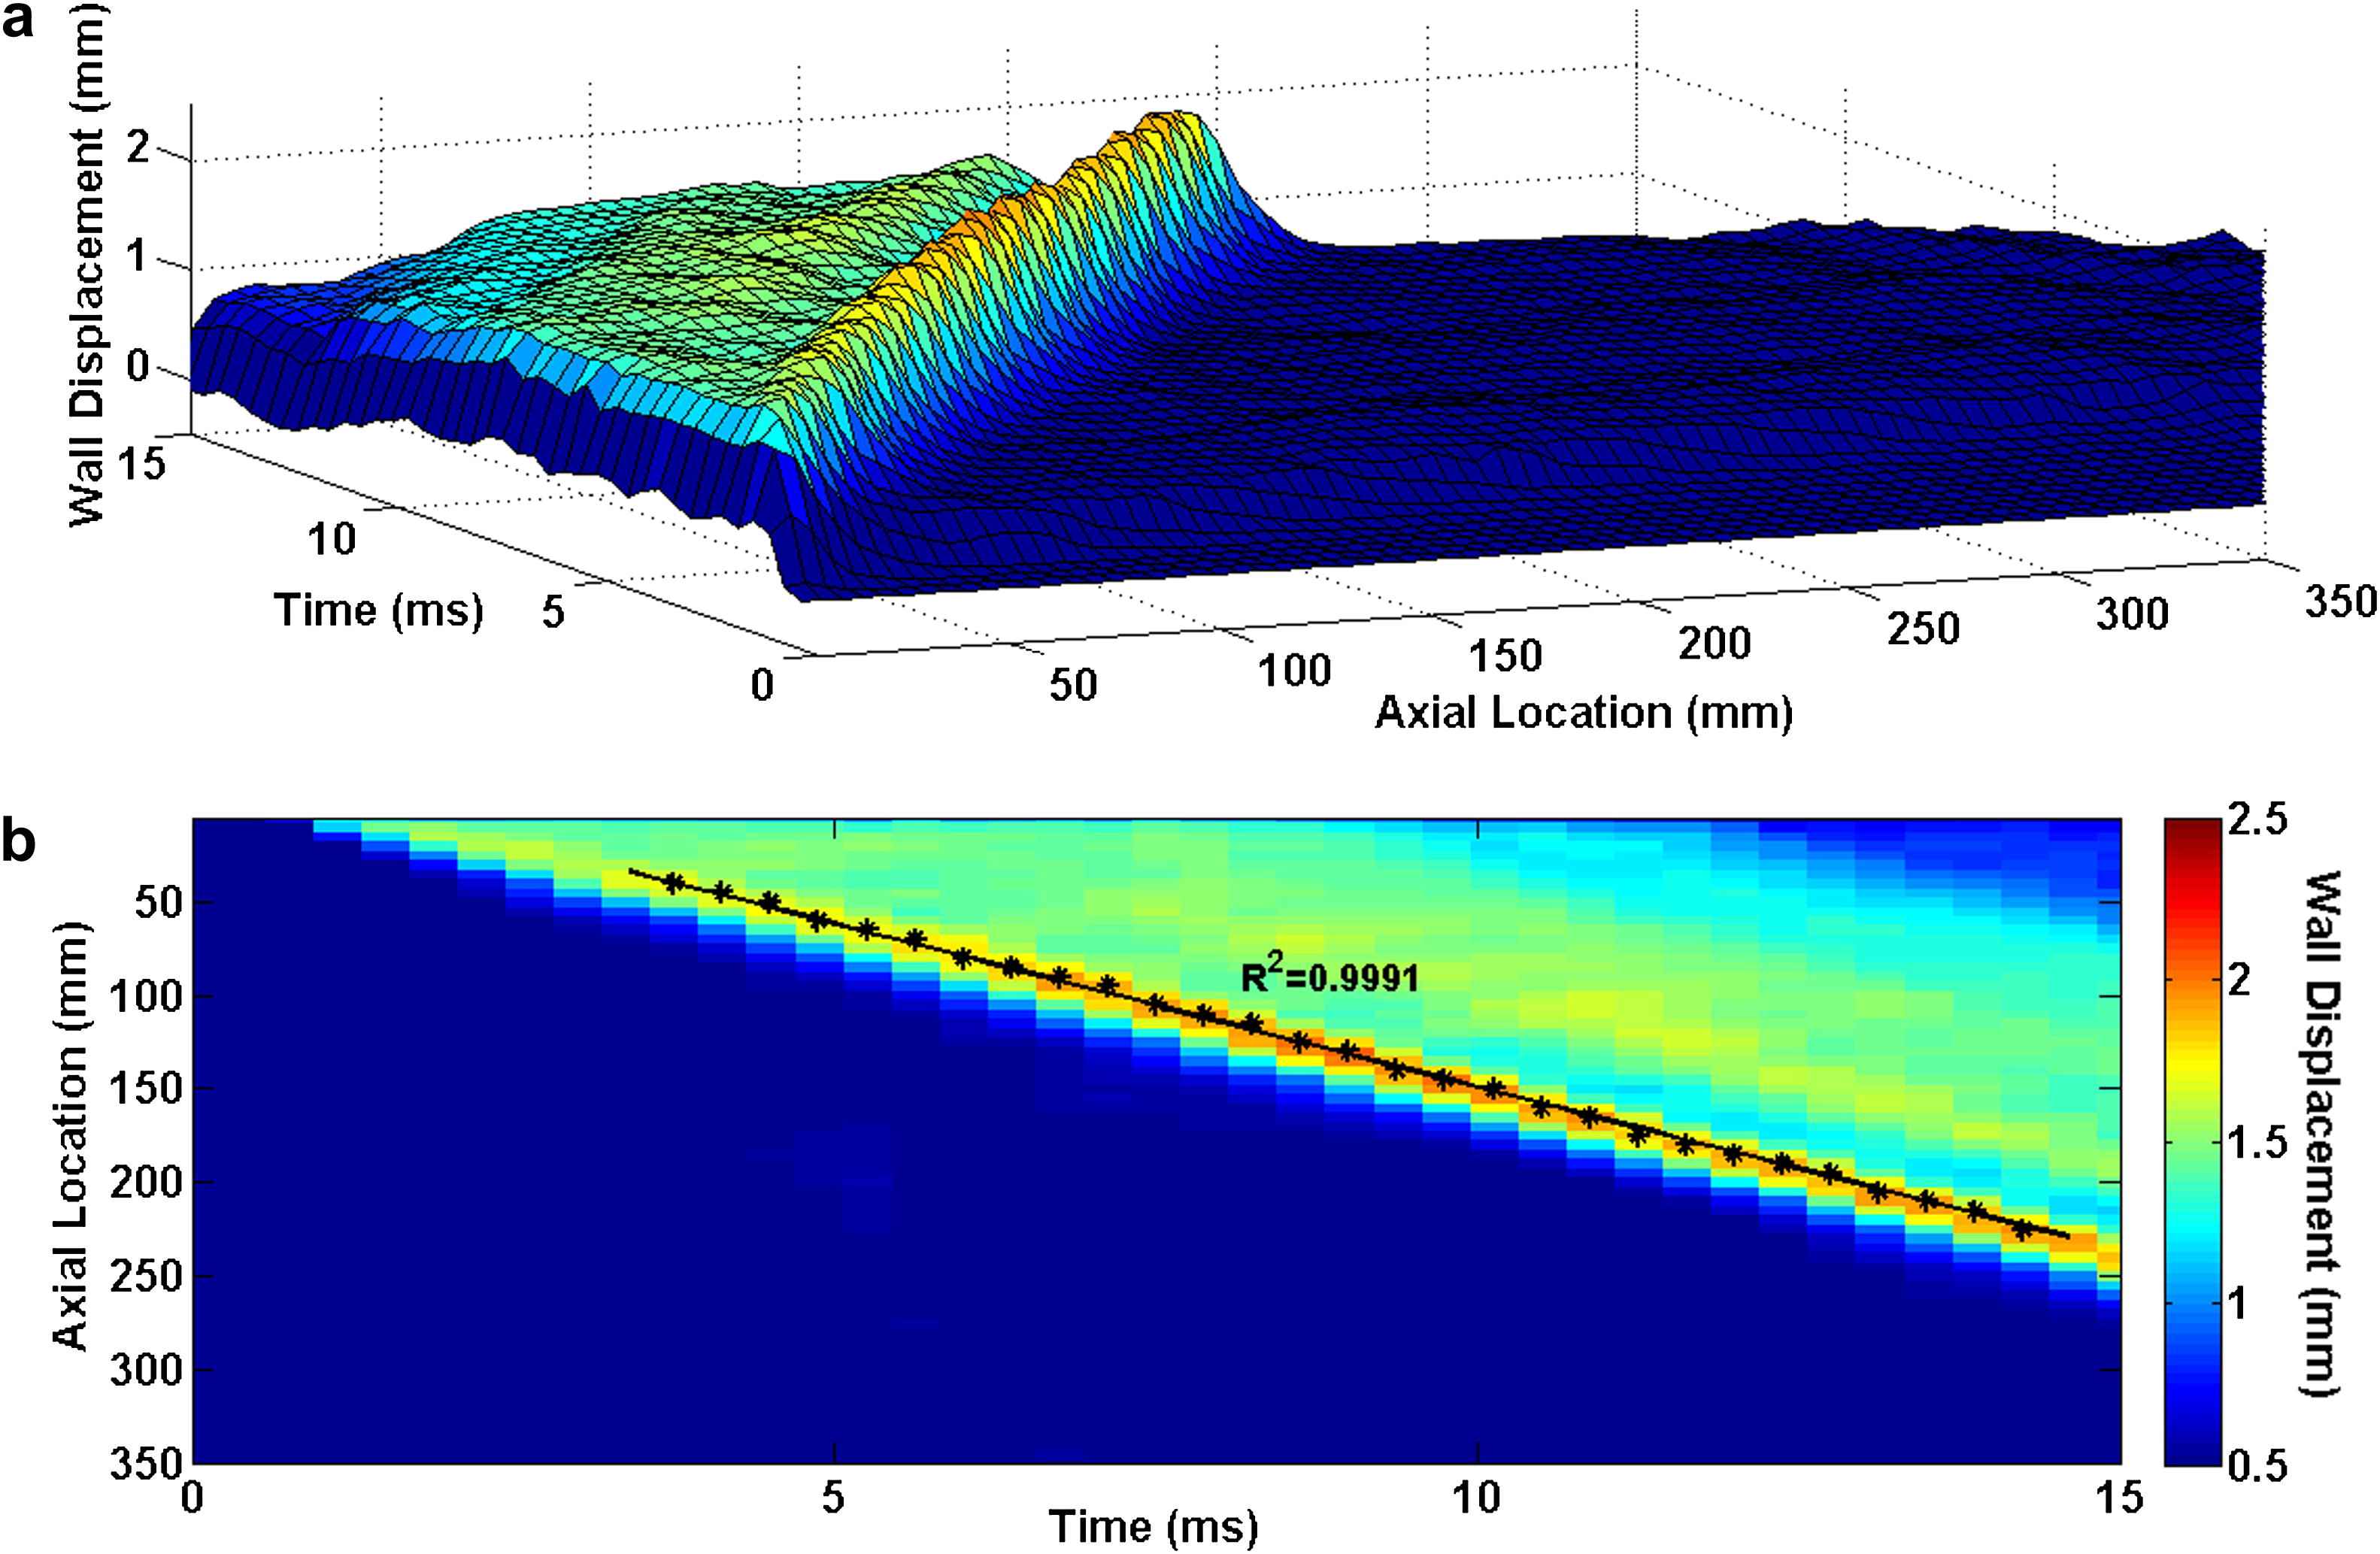
Homogenous model with Young’s modulus of E3 = 5.12 MPa: (a) 3D waterfall plots of the wall displacement against temporal and spatial coordinates on the aortic wall. (b) 2D spatio-temporal plot of the wall displacement. Also shown are the peaks on the forward wave.
Homogenous model with Young’s modulus of E5 = 7.68 MPa: (a) 3D waterfall plots of the wall displacement against temporal and spatial coordinates on the aortic wall. (b) 2D spatio-temporal plot of the wall displacement. Also shown are the peaks on the forward wave.
PWV-E correlation
Fig. 6 shows the pulse wave velocity-squared versus Young’s modulus data from the five aforementioned homogenous models. A very high correlation was established (R2 = 0.9988) which indicates that the current model is able to accurately detect the increase in the wall modulus based on the higher pulse wave velocity.
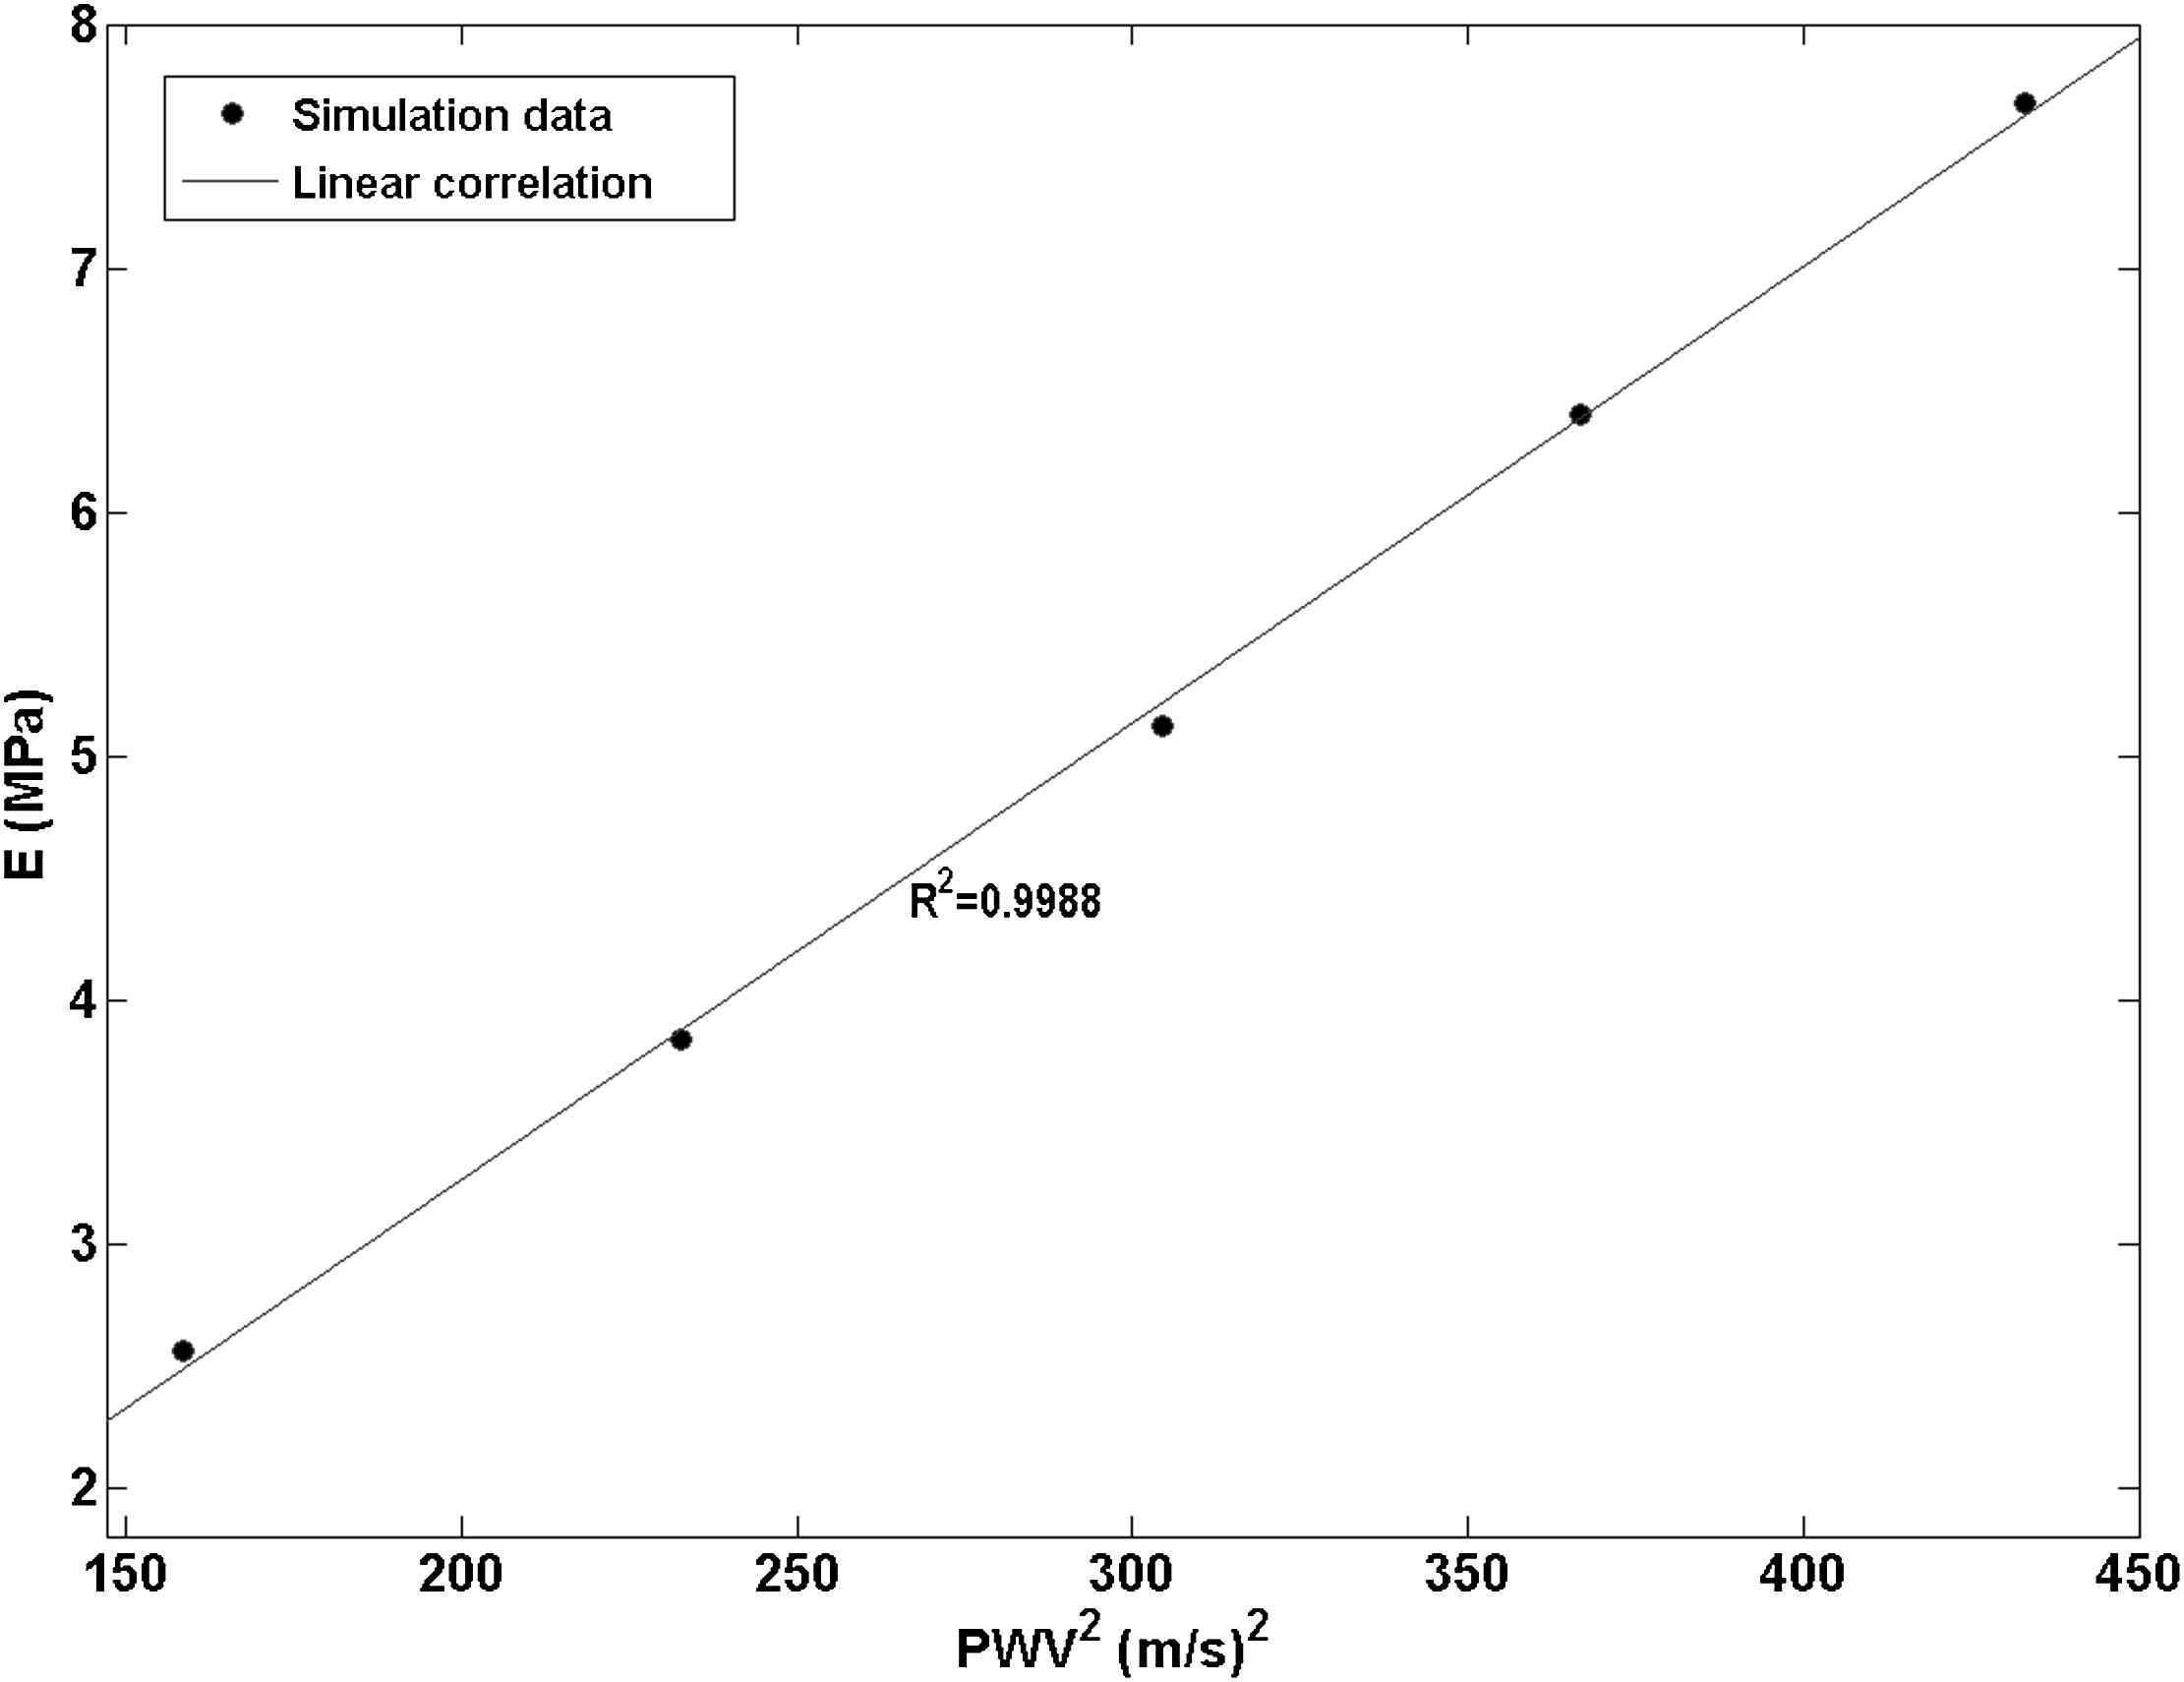
Linear correlation established (R2 = 0.9988) between the pulse wave velocity-squared vs. Young’s modulus data points obtained from five models with homogenous walls with a modulus of E1 through E5.
Wall with hard inclusion
The 3D waterfall plots as well as the 2D spatio-temporal maps of the wall motion obtained from the model with hard inclusion are shown in Fig. 7. Qualitative examination of the plots shows that a portion of the supra-inclusion forward wave continues to travel through the inclusion, while another portion of it gets reflected at the inclusion site. However, the hard inclusion does not seem to affect the velocity of the forward wave beyond the inclusion site. The quantitative pulse wave velocity measurements obtained from the linear fits indicate the supra- and infra-inclusion PWVs as 12.24 m/s (R2 = 0.9970) and 12.59 m/s (R2 = 0.9951), respectively. A PWV of 7.61 m/s (R2 = 0.9516) was measured on the reflected wave.
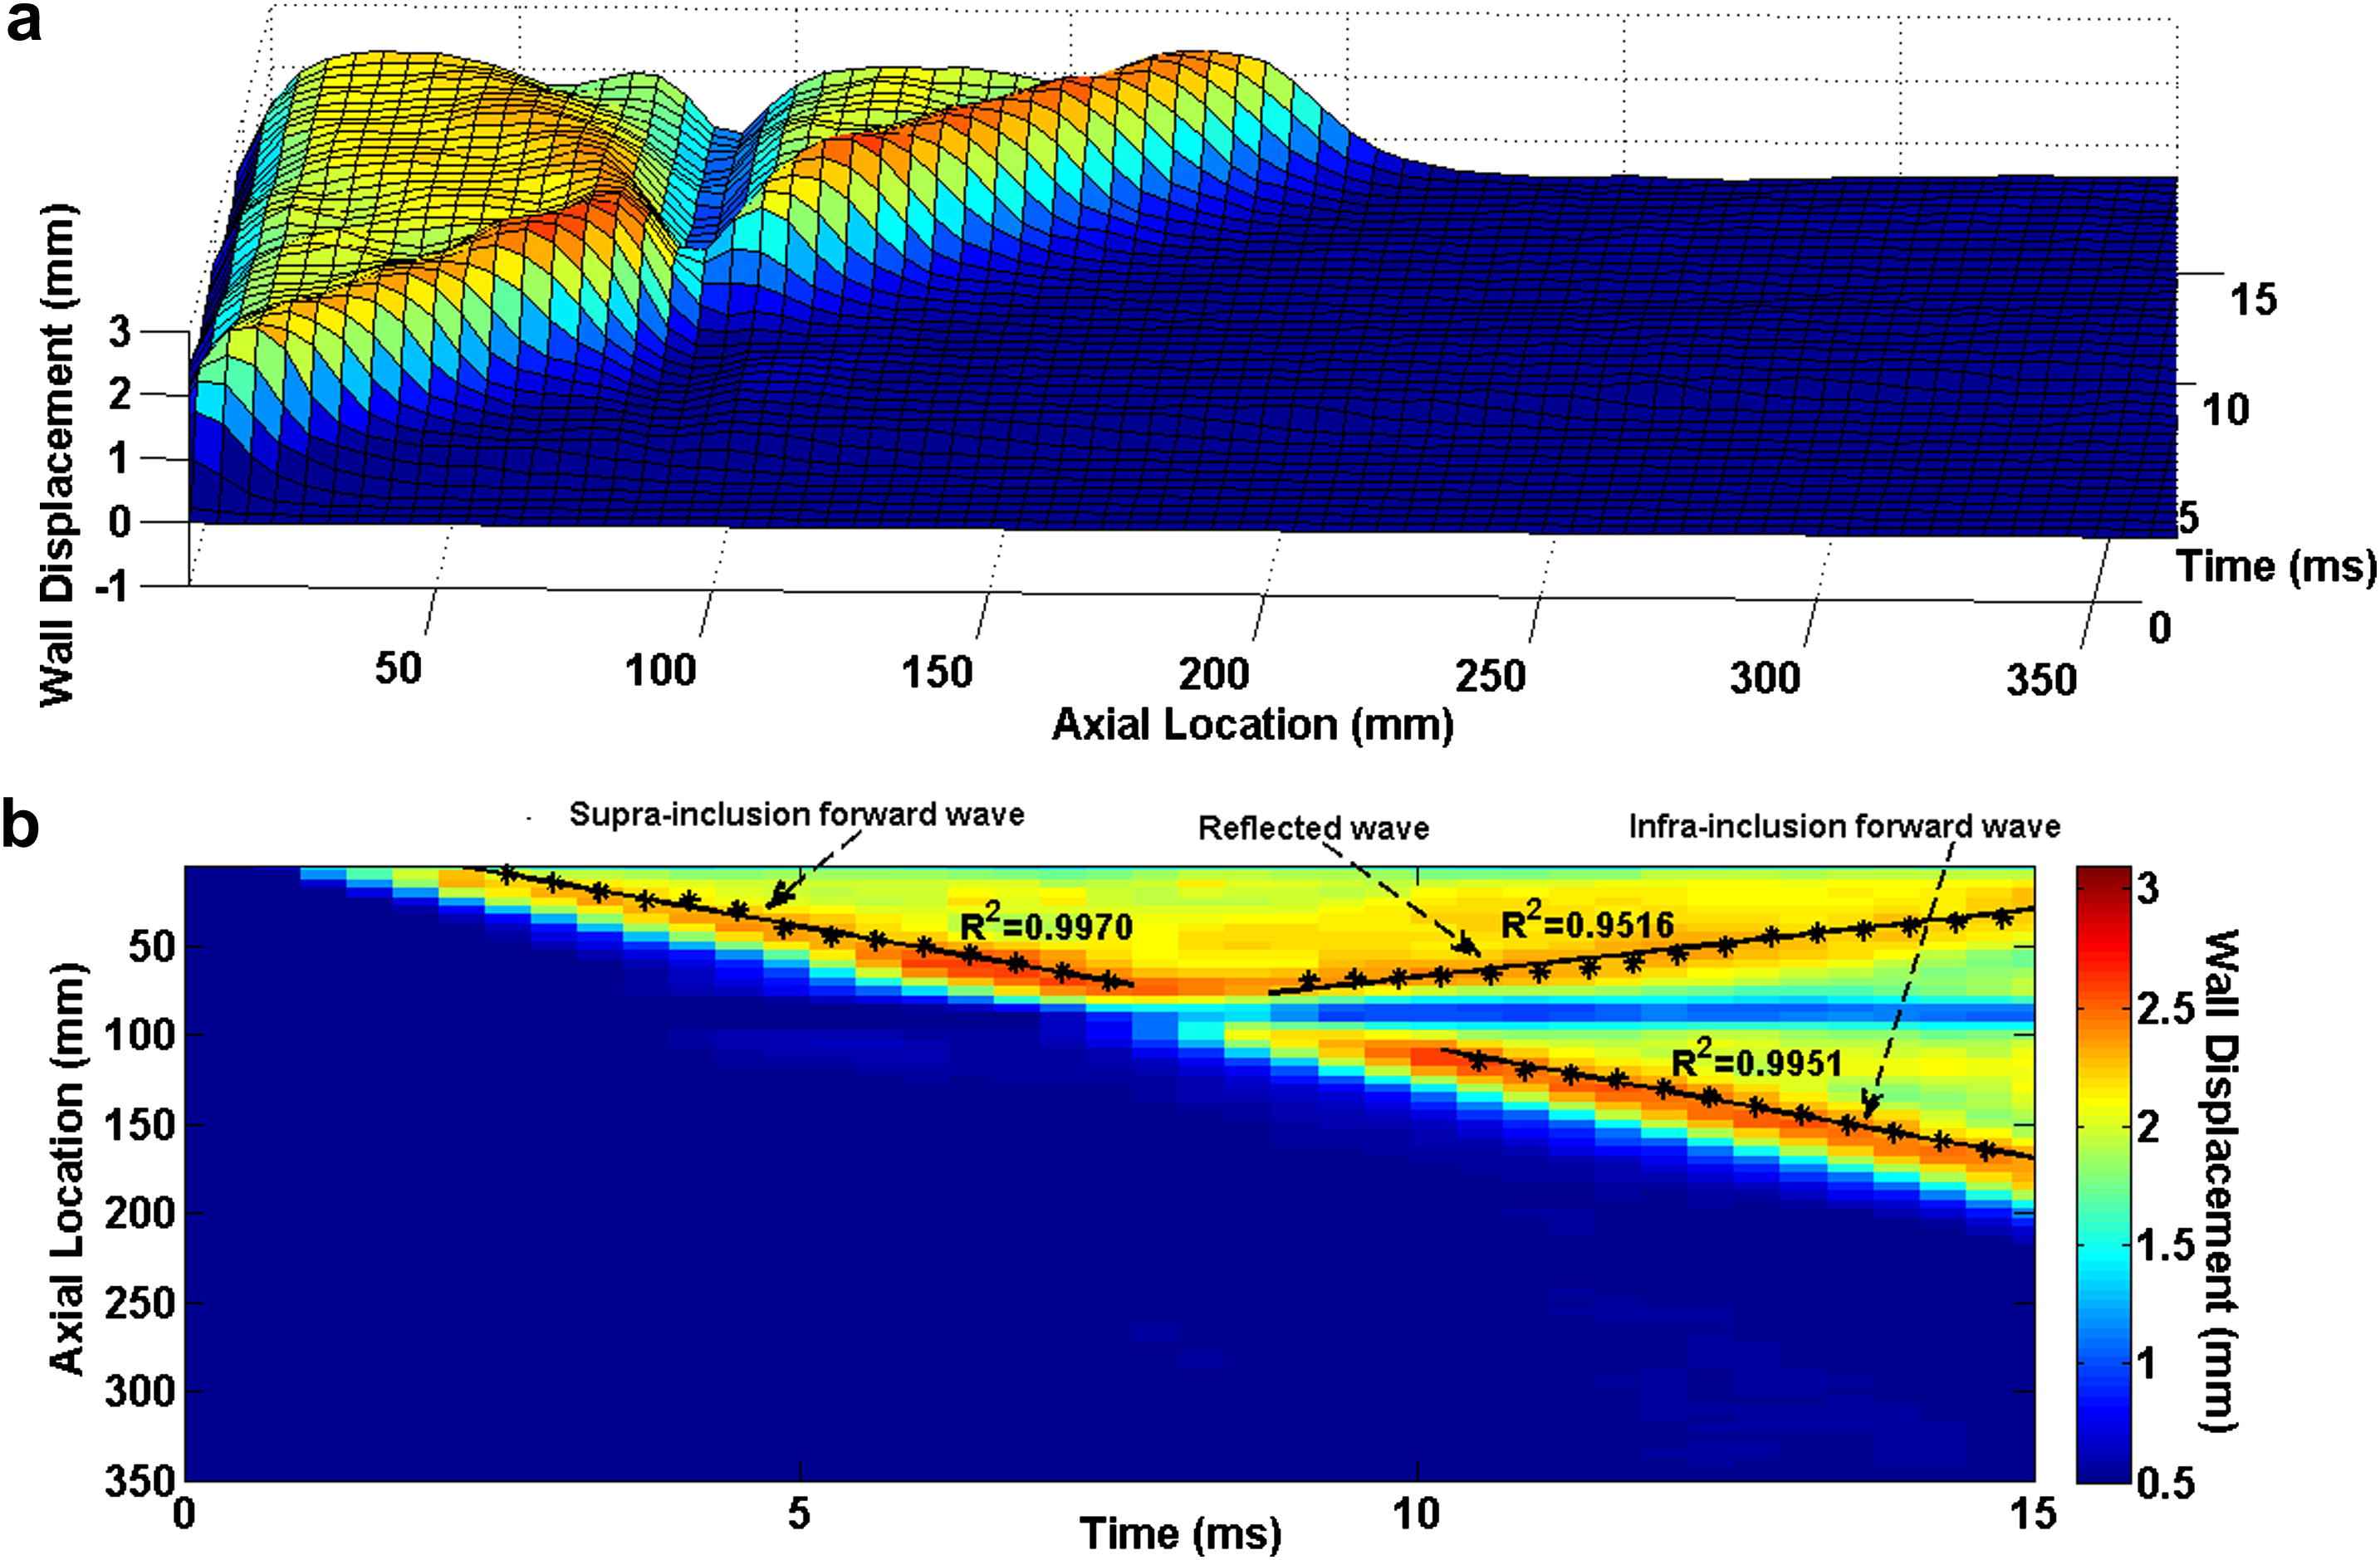
E1 = 2.56 MPa arterial wall with Ehard−incl = 7.68 MPa hard inclusion: (a) 3D waterfall plots of the wall displacement against temporal and spatial coordinates on the aortic wall. (b) 2D spatio-temporal plot of the wall displacement. Also shown are the peaks on the forward and reflected waves.
Wall with soft inclusion
Similarly in the case of the soft inclusion model, the 3D waterfall plots as well as the 2D spatio-temporal maps of the wall motion are shown in Fig. 8. As expected, the highest wall displacement occurred at the site of the inclusion where the wall was the softest. The qualitative observation on the spatio-temporal plots shows the existence of a standing wave at the inclusion site. It is found that, similar to the hard inclusion model, the soft inclusion does not cause any noticeable effect on the velocity of the forward wave. Based on the quantitative pulse wave velocity measurements obtained from the linear fits, the supra- and infra-inclusion PWVs are 20.32 m/s (R2 = 0.9951) and 20.70 m/s (R2 = 0.9984), respectively.
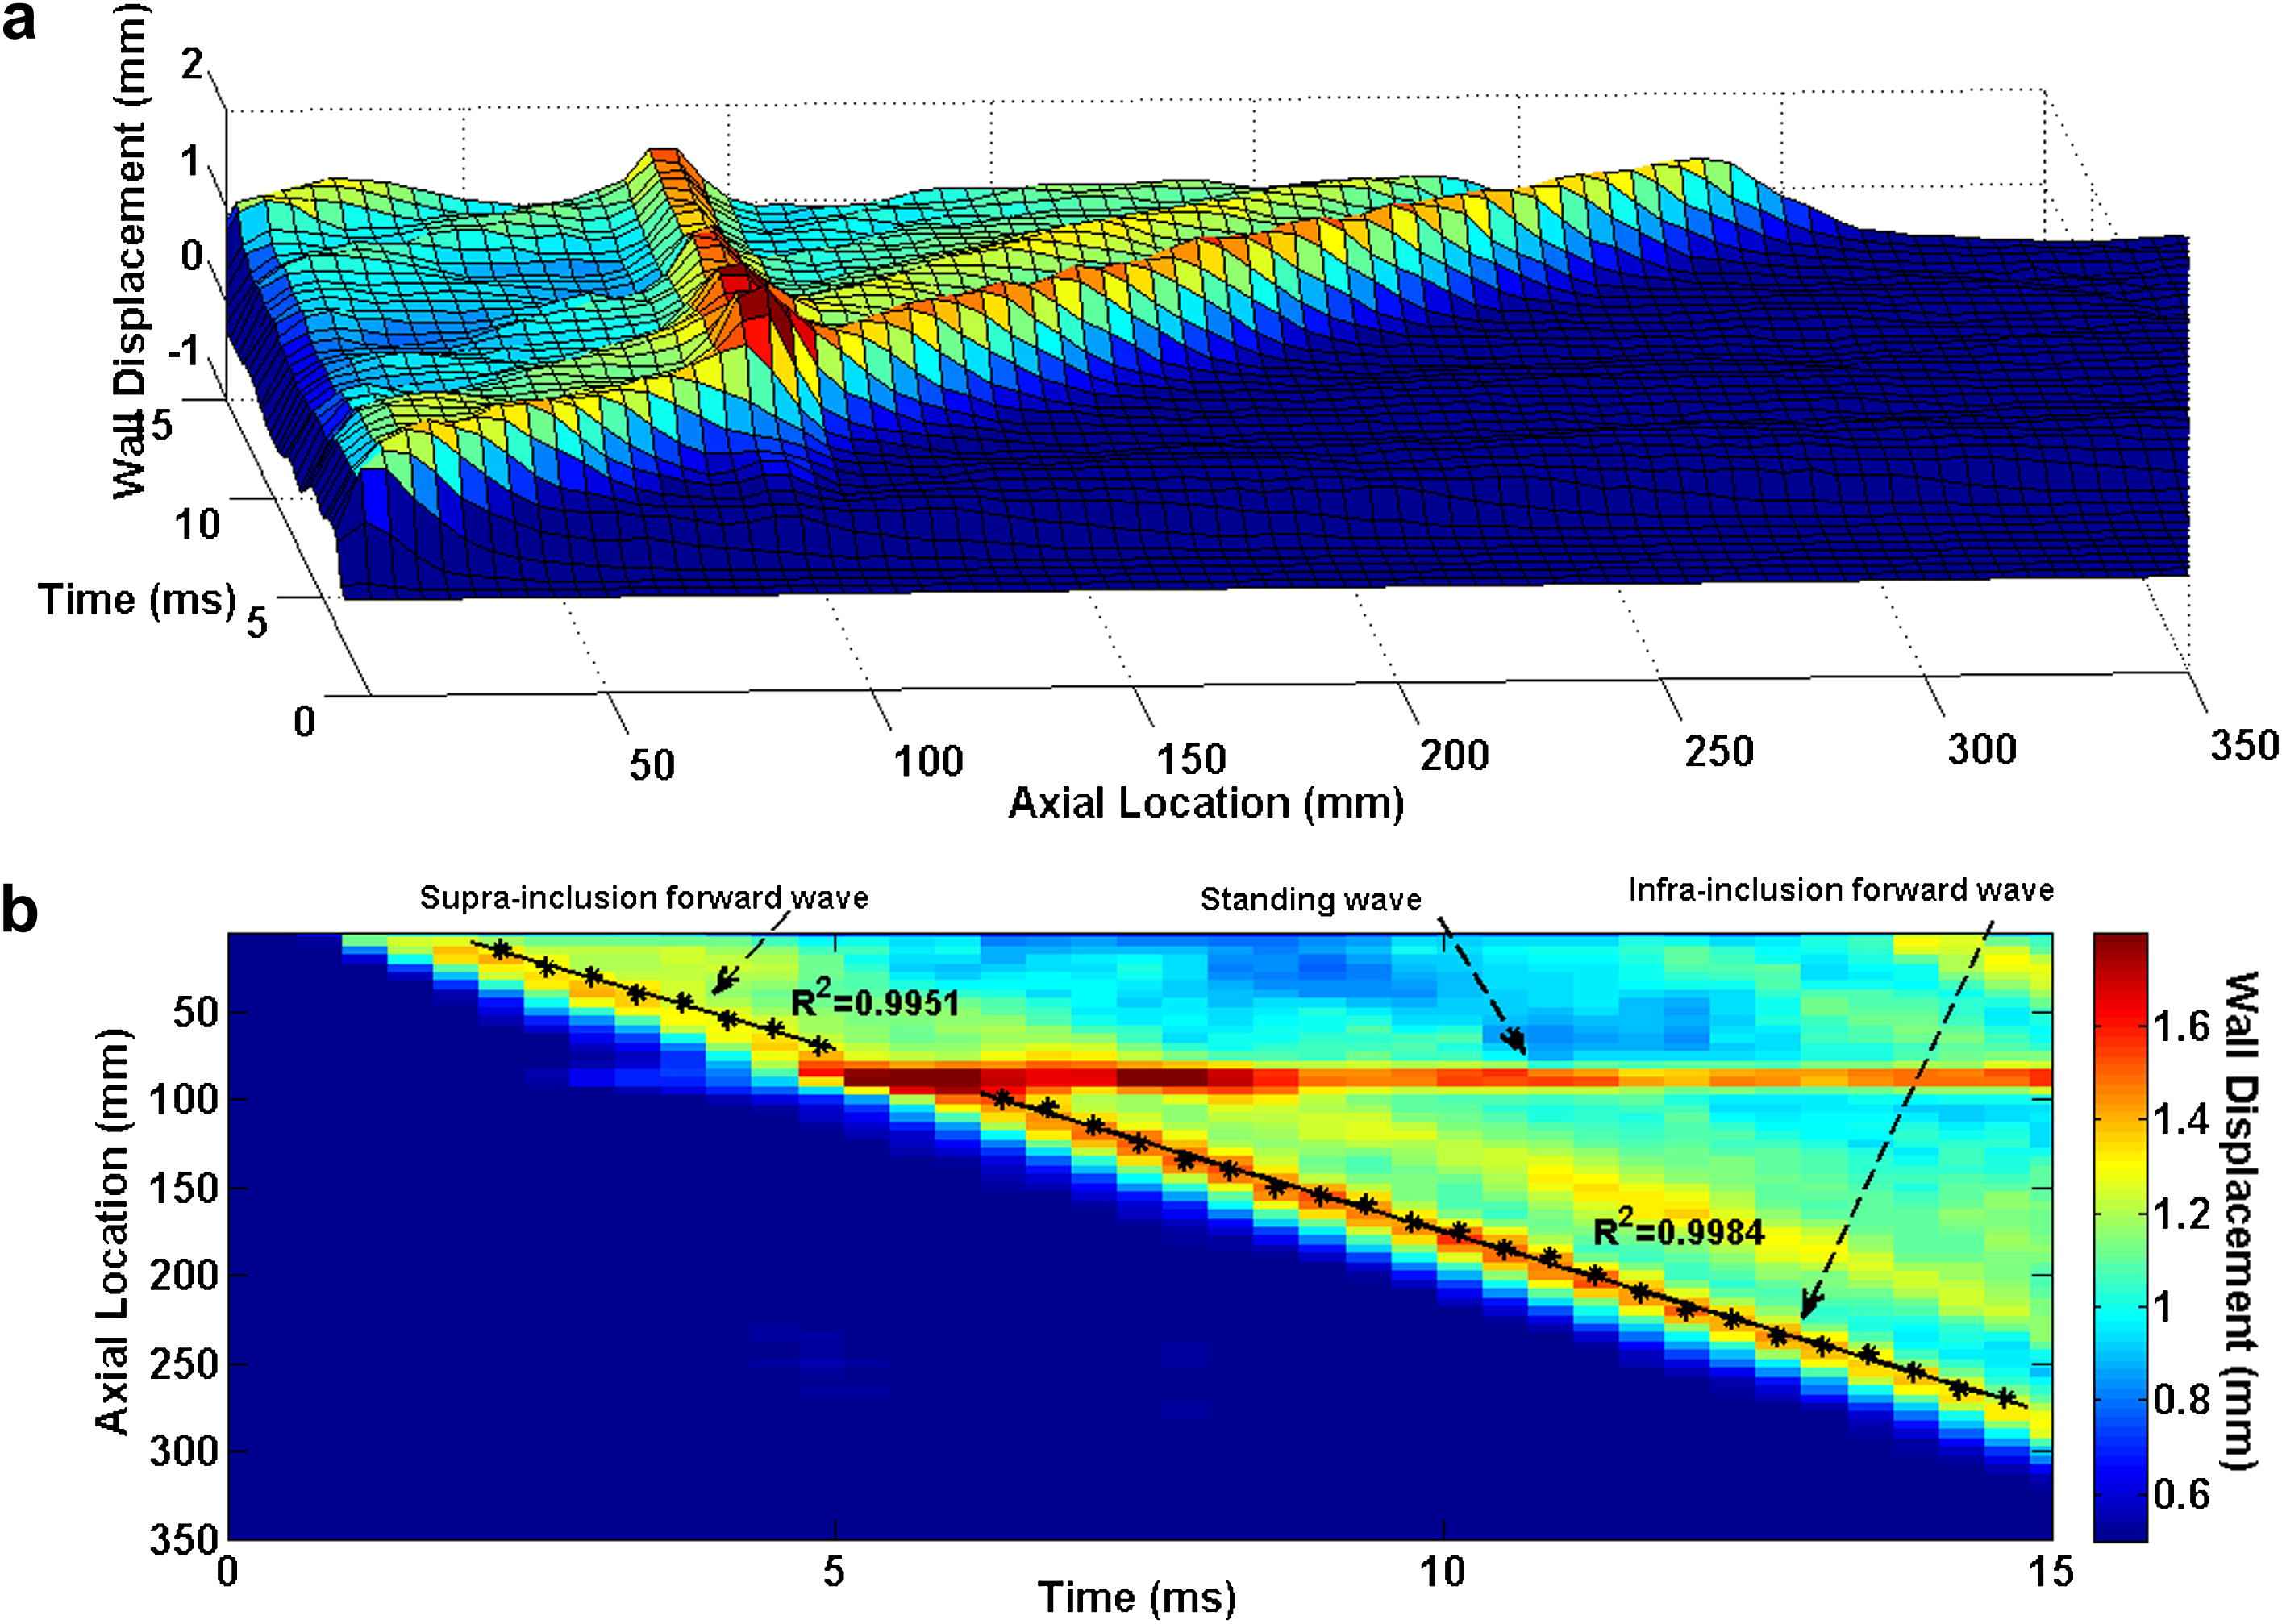
E5 = 7.65 MPa arterial wall with Esoft−incl = 2.56 MPa soft inclusion: (a) 3D waterfall plots of the wall displacement against temporal and spatial coordinates on the aortic wall. (b) 2D spatio-temporal plot of the wall displacement. Also shown are the peaks on the forward waves.
Discussion
The current gold standard of noninvasive estimation of PWV in clinical practice is to obtain a global measure by determining the temporal pulse pressure profiles in two remote sites, typically the carotid and femoral arteries.16,26 However, the carotid-femoral method suffers from major issues such as the lack of knowledge of the exact arterial geometry and the assumption of a single longitudinal flow direction which can impair the accuracy of the method by underestimating/overestimating the true traveled distance. Yet, the most important disadvantage of the method could be the global nature of the measurement which averages the PWV over a long distance.35 The disadvantage of global PWV measurements is previously discussed considering that the majority of the vascular diseases induce focal changes.32–34
This study reports the use of numerical FSI modeling of the aortic pulse wave propagation in order to shed light into the effects of regional stiffness changes on the global PWV measures. Five homogenous models of increasing stiffness as well as two models with hard and soft inclusions were examined.
Supplementary videos of the animated results can be found at doi:10.1016/j.artres.2012.05.004.
The results from the homogenous models showed that the numerical model developed was able to effectively capture the correlation between the increasing wall modulus and the PWV2 as established by the high correlation coefficient of R2 = 0.9988 (Fig. 6).
Qualitative examination of the PWI spatio-temporal plots obtained from the inclusion models could be used to identify the existence and nature of the inclusions. Figs. 3 and 7 show the PWI spatio-temporal maps of the wall motion at 2.56 MPa without and with the hard inclusion of 7.68 MPa, respectively. As seen in Fig. 7, the hard inclusion caused a reflection wave which was not seen on the homogenous model (Fig. 3). In the case of the soft inclusion, Figs. 5 and 8 show the spatio-temporal maps of the wall motion at 7.68 MPa without and with the soft inclusion of 2.56 MPa, respectively. Unlike in the case of the homogenous model (Fig. 5), Fig. 8 showed the soft inclusion generating a standing wave at the inclusion site. The emergence of the reflected and standing waves can be used as potential markers to identify the regional increase and decrease in the wall stiffness, respectively. Additionally, the part of the spatio-temporal plots associated with the displacement of the inclusion showed up as a region of minimum (maximum) displacement on the site of the hard (soft) inclusion, respectively (Figs. 7 and 8), while the width of that region appears to be dependent on the inclusion size. Further quantification of such a relationship is needed in estimating not only the regional stiffness change but also the size of the lesion based on PWI in vivo.
Table 1 summarizes the PWVs obtained from the model with different parameters. The results show that a regional change in the wall stiffness, whether softening or stiffening, may not induce measurable effects on the downstream PWV. In the case of the hard inclusion, the supra-inclusion PWV differed from that of the homogenous model by only −2.78% where the infra-inclusion PWV did not show any measurable difference. Similarly, in the case of the soft inclusion, the supra- and infra-inclusion PWVs had only a −2.35% and 0.53% difference from the true PWV in the homogeneous model, respectively. This observation indicates that even high regional stiffness contrasts are not detectable by global PWV measurements. In addition, the PWV measured on the reflected wave was about 40% lower than that measured on the forward wave using the same model parameters. This could likely be due to the relative proximity of the inclusion site to the ends of the cylinder (i.e. at 90 mm distance from the tube inlet), which causes the reflected wave to be attenuated immediately after its formation and not freely propagating. Ongoing parametric studies are carried out to quantify the effects of vessel length and inclusion properties such as inclusion size, inclusion modulus contrast, and location of (multiple) inclusion(s) on the wave propagation pattern. The results from these studies would provide a better and more quantitative understanding of the wave propagation along an inhomogeneous wall.
| Model | Young’s modulus (MPa) | Wave type | PWV (m/s) |
|---|---|---|---|
| Homogenous | Wall: 2.56 | Forward | 12.59 |
| Wall: 3.84 | Forward | 15.25 | |
| Wall: 5.12 | Forward | 17.45 | |
| Wall: 6.40 | Forward | 19.15 | |
| Wall: 7.68 | Forward | 20.81 | |
| Hard inclusion | Wall:2.56 / Inclusion:7.68 | Supra-inclusion forward | 12.24 |
| Reflected | 7.61 | ||
| Infra-inclusion forward | 12.59 | ||
| Soft inclusion | Wall:7.68 / Inclusion: 2.56 | Supra-inclusion forward | 20.32 |
| Reflected | 0 (i.e. standing) | ||
| Infra-inclusion forward | 20.70 | ||
Summary of the PWV measurements on models with homogenous and inhomogeneous (inclusion) models.
Given the near incompressibility of the tissue, an increase in r (radius) during pulsation could be accompanied by a decrease in t (thickness), and therefore the r/t ratio could also be a variable during the Moens–Korteweg-based estimation of the E on the inclusion models. It was found that there could be a difference in the r/t ratio around 5–15%, depending on the inclusion modulus contrast, which is negligible compared to the 150–300% change in E.
Finite-element simulations for describing such dynamic phenomena could serve as a powerful tool but could also be compromised by a number of factors. First, the computational cost can potentially be an impediment particularly in the case of full 3D patient specific complex geometries. This may require focal mesh density enhancements and computations over multiple cardiac cycles in order to achieve steady state behavior of wall regional motion. In the present study, however, the computational cost was relatively low owing largely to the simple straight-tube geometry and the simulation period of a single pulsatile cycle. Second, the solution of the simulation models was significantly affected by the initial and boundary conditions – neither of which can ideally mimic the in vivo state – and should be interpreted carefully in the context of the application. An isolated cylindrical tube with a linearly elastic wall being stimulated by an impulse fluid velocity would be in best agreement with the Moens–Korteweg formulation. In particular, the perfect symmetry of the solid and fluid geometries, initial and boundary conditions, fluid–solid interface, etc., ensure the formation and free propagation of a symmetric wave while the tube cross-section remains circular and inplane throughout.
The results presented here may not be representative of the in vivo configurations. However, this constitutes the first time –to the best of our knowledge– that the effects of inclusion on wave propagation were studied and the shortcoming of the global PWV measurements on detecting the local changes in the stiffness was observed. The present results on the straight-geometry provide good insight on how to assess and interpret the regional variations obtained from PWI in vitro and in vivo where the complexities of a more inhomogeneous wall, irregular geometry and physiological conditions may occur simultaneously. Ongoing studies are being conducted to adapt physiological conditions to the model such as a patient-specific blood velocity profile using Doppler ultrasound.
Conclusion
The present study primarily aimed at showing the feasibility of using the numerical methods to simulate the pulse wave propagation in simple aorta models and compute the local Pulse Wave Velocity (PWV) to detect changes in regional stiffness. The results indicated the significance of using Pulse Wave Imaging (PWI), over traditional methods such as carotid-femoral PWV measurement, in accurately depicting the change in arterial stiffness where global PWV fails. A finite-element model of fluid-structure interaction in straight-geometry arteries with homogenous and inhomogeneous walls were established to perform PWI in silico. The spatio-temporal map of the wall deformation obtained from the PWI enables the depiction of the inclusion and its size. It also provides important information on the regional propagation of the forward, reflected and standing waves which could be used for better identification of the regional wall discontinuities. Most importantly, similar PWVs were found for the waves upstream and downstream of the inclusion –with neither of them significantly different from the PWV on the homogenous model– emphasizing thus that the methods based on global PWV measurements may not be suited for detecting small, regional changes in the wall stiffness as encountered under pathological conditions. The outcome of this study encourages the potential application of PWI for the noninvasive estimation of regional changes in arterial PWV and wall stiffness –an important biomarker for a wide range of cardiovascular-related diseases and treatment thereof. Future studies are needed to further implement the method on patient-specific and physiological aorta models.
Acknowledgements
This study was supported in part by the National Institutes of Health (R01-HL098830).
Appendix A
Supplementary data
Supplementary data related to this article can be found online at doi:
References
Cite this article
TY  - JOUR
AU  - Danial Shahmirzadi
AU  - Elisa E. Konofagou
PY  - 2012
DA  - 2012/07/17
TI  - Detection of aortic wall inclusions using regional pulse wave propagation and velocity in silico
JO  - Artery Research
SP  - 114
EP  - 123
VL  - 6
IS  - 3
SN  - 1876-4401
UR  - https://doi.org/10.1016/j.artres.2012.05.004
DO  - 10.1016/j.artres.2012.05.004
ID  - Shahmirzadi2012
ER  -