
Dissociation of Carotid and Forearm Pressure Decay Constants (tau), Windkessel Compliances, and Pulse Wave Velocities: Implications for Circulatory Models
- DOI
- 10.2991/artres.k.191210.002How to use a DOI?
- Keywords
- Arterial tonometry; tau; pressure decay; Windkessel model; arterial compliance; circulatory models
- Abstract
Windkessel (WK) models have often been used to simulate the arterial circulation. We studied a critical characteristic of WK function, the arterial pressure-decay constant tau, to test whether all arterial regions share the same WK characteristics, which should theoretically be related to arterial stiffness. We performed carotid and forearm arterial tonometry (Sphygmocor) and modeled arterial pressure (P) as A + (SBP − A)⋅exp[−(t − t0)/tau], where A = minimum pressure, SBP = systolic BP, t = time, t0 = start of decay). Model validity was supported by strong between-site correlations for t0 and A. We also measured central and peripheral Pulse Wave Velocity (PWV, Colin VP1000) and calculated arterial compliances (1/PWV2) in the heart-femoral (hf) and femoral-ankle (fa) regions. For the full cohort [n = 98, mean (SD): age 50 (20) years, weight 81 (17) kg, BP 135/77 (17/12) mmHg, 38% female], carotid and forearm taus were different [283 (126) vs. 199 (88) ms, p < 0.000] and uncorrelated (r2 = 0.01). Although hf and fa arterial compliances were well correlated (p < 0.000), neither was closely correlated with carotid or forearm tau (r2 < 0.06). In a subset (n = 22), carotid and brachial blood flow (Ultramark 9) were measured and regional WK compliances were calculated (= tau/regional resistance). Carotid blood flow [571 (216) vs. 117 (84) mL/min, p < 0.000] and WK compliance [0.031 (0.017) vs. 0.004 (0.004) mL/mmHg, p < 0.000] were much higher than corresponding forearm values. We conclude that: (1) tau and WK compliance are regional, not systemic indicators, (2) neither carotid nor forearm tau reflects large artery stiffness, and (3) a single WK model cannot adequately describe the arterial circulation.
- Copyright
- © 2019 Association for Research into Arterial Structure and Physiology. Publishing services by Atlantis Press International B.V.
- Open Access
- This is an open access article distributed under the CC BY-NC 4.0 license (http://creativecommons.org/licenses/by-nc/4.0/).
1. INTRODUCTION
Investigations into the pathogenesis and clinical implications of arterial aging, systolic hypertension, and cardiovascular risk profiling have been based on the indirect assessment of the cushioning function of the arterial tree using such parameters as arterial compliance (the change in arterial volume for a given change in pressure) or its inverse, arterial stiffness [1–3]. This approach has not been without theoretical and practical problems, however. The original Bramwell-Hill and Moens-Korteweg equations defined arterial stiffness as the square of the local Pulse Wave Velocity (PWV [2]) but most studies have used PWV [1–3]. Arterial stiffness (or compliance) is intrinsically dependent on initial pressure and diameter but these critical influences have been ignored in most clinical studies [1–3]. The notion that there is a single PWV that defines “whole-body arterial stiffness” is also highly questionable. PWV, like systolic BP (SBP) and pulse pressure, varies with measurement site and increases substantially with distance from the heart. Thus, any conventional PWV determined between any two measurement sites is automatically a lumped parameter that differs from the measurement site at each end [1]. Finally, the most common PWV measurement techniques, including carotid-femoral PWV, actually cross two dissimilar arterial regions.
Another approach to arterial compliance is provided by the Windkessel model (WK), in which tau, the exponential arterial pressure decay constant (in ms), is the product of the WK’s compliance and resistance [4–7]. Tau is thus a defining characteristic of any WK. Tau is hypothetically pressure-independent but in reality, tau is affected by two factors (resistance and compliance) that are themselves related to arterial pressure. Tau is also theoretically flow-independent but the calculation of arterial resistance requires knowledge of pressure and flow. Tau is inversely related to beta, the exponent of any artery’s pressure-volume function and thus also represents the arterial “stiffening” function [3]. Tau, like arterial stiffness, is a modest cardiovascular disease risk factor [7].
The purpose of the current preliminary studies was to compare WK model data (principally tau and WK compliance) from two different arterial regions to address the question of whether a single “whole-body” WK can adequately represent the arterial circulation. We specifically asked whether: (1) tau values from low and high resistance arterial regions (carotid and forearm, respectively) are similar and related, thus systemic; and (2) carotid and forearm WK compliance values are consistent with corresponding regional arterial compliance values (1/PWV2).
2. MATERIALS AND METHODS
2.1. Participant Selection
All subjects signed informed consent and the study was approved and monitored by the Health Sciences IRB of the University at Buffalo. They included both normotensive and hypertensive individuals; the latter group was treated with various antihypertensive agents. Care was taken to select about 10–12 subjects per decade of life, split roughly equally by gender and over a wide age range so as to mimic the NHANES III selected cohort [8].
2.2. Physiologic Measurements
All measurements were conducted in the afternoon in the non-invasive cardiac laboratory, with subjects supine for at least 20 min before study. All measurements were completed within 1 h. BP was determined by standard oscillometric BP determination (mean of ≥3 values); Mean Arterial Pressure (MAP) was calculated as diastolic BP + 1/3·PP. Carotid and radial tonometry were performed using standard technique (Sphygmocor, AtCor Medical, Sydney, Australia). This method yields a graphical output of a 10-s ensemble-averaged pulse waveform (roughly 6–10 heartbeats). These tracings were then photo-digitized (WebPlot Analyzer) at roughly 20 ms intervals and stored digitally for analysis. Radial tonometry was chosen over brachial to optimize fidelity. Carotid and femoral blood flow were measured with an Ultramark 9 with a 10 mHz probe in the brachial artery to optimize fidelity. Carotid and brachial vascular resistance was calculated as MAP/regional blood flow. PWV values from central (heart-femoral, hfPWV) and muscular conduit artery (femoral-ankle, faPWV) sites were determined with a Colin VP1000 with correction for arterial path length.
2.3. Modeled Data
Because arterial pressure waveforms are complex curves with variable timing and amplitude of secondary pressure perturbations (especially in late systole and early diastole), we inspected each tonogram and modeled tau from pressure values after the early diastolic pressure peak (usually about 400–450 ms) at 20–50 ms intervals until the end of diastole. The general model for arterial pressure decay is P = A + B*exp(−t/tau), where t is time, A is the minimum modeled BP (P at t = infinity), B is the pressure at the start of pressure decay, and tau is the pressure-decay constant. For practical reasons, however, we modified this formula as: P = A + B·exp(−[t − t0]/tau), where B = (SBP − A), SBP is systolic BP, and t0 is the calculated pressure decay start-time (intersection of the horizontal denoting peak SBP and the exponential decay curve). These variables are displayed graphically in Figure 1. In all cases, the model fit was excellent, with r > 0.998. In some individuals, there was an appreciable lag (100 ms) between the observed time of the early systolic pressure peak and the calculated t0; using the observed timing of the systolic pressure peak in such individuals would have markedly altered tau. Similarly, the inclusion of A in the model has been recommended [9] and in our experience, its inclusion ameliorates distortions of tau caused by unusual pressure perturbations at the end of diastole. WK-compliance was defined as tau/regional vascular resistance, in turn estimated as [brachial mean arterial pressure]/[regional blood flow].
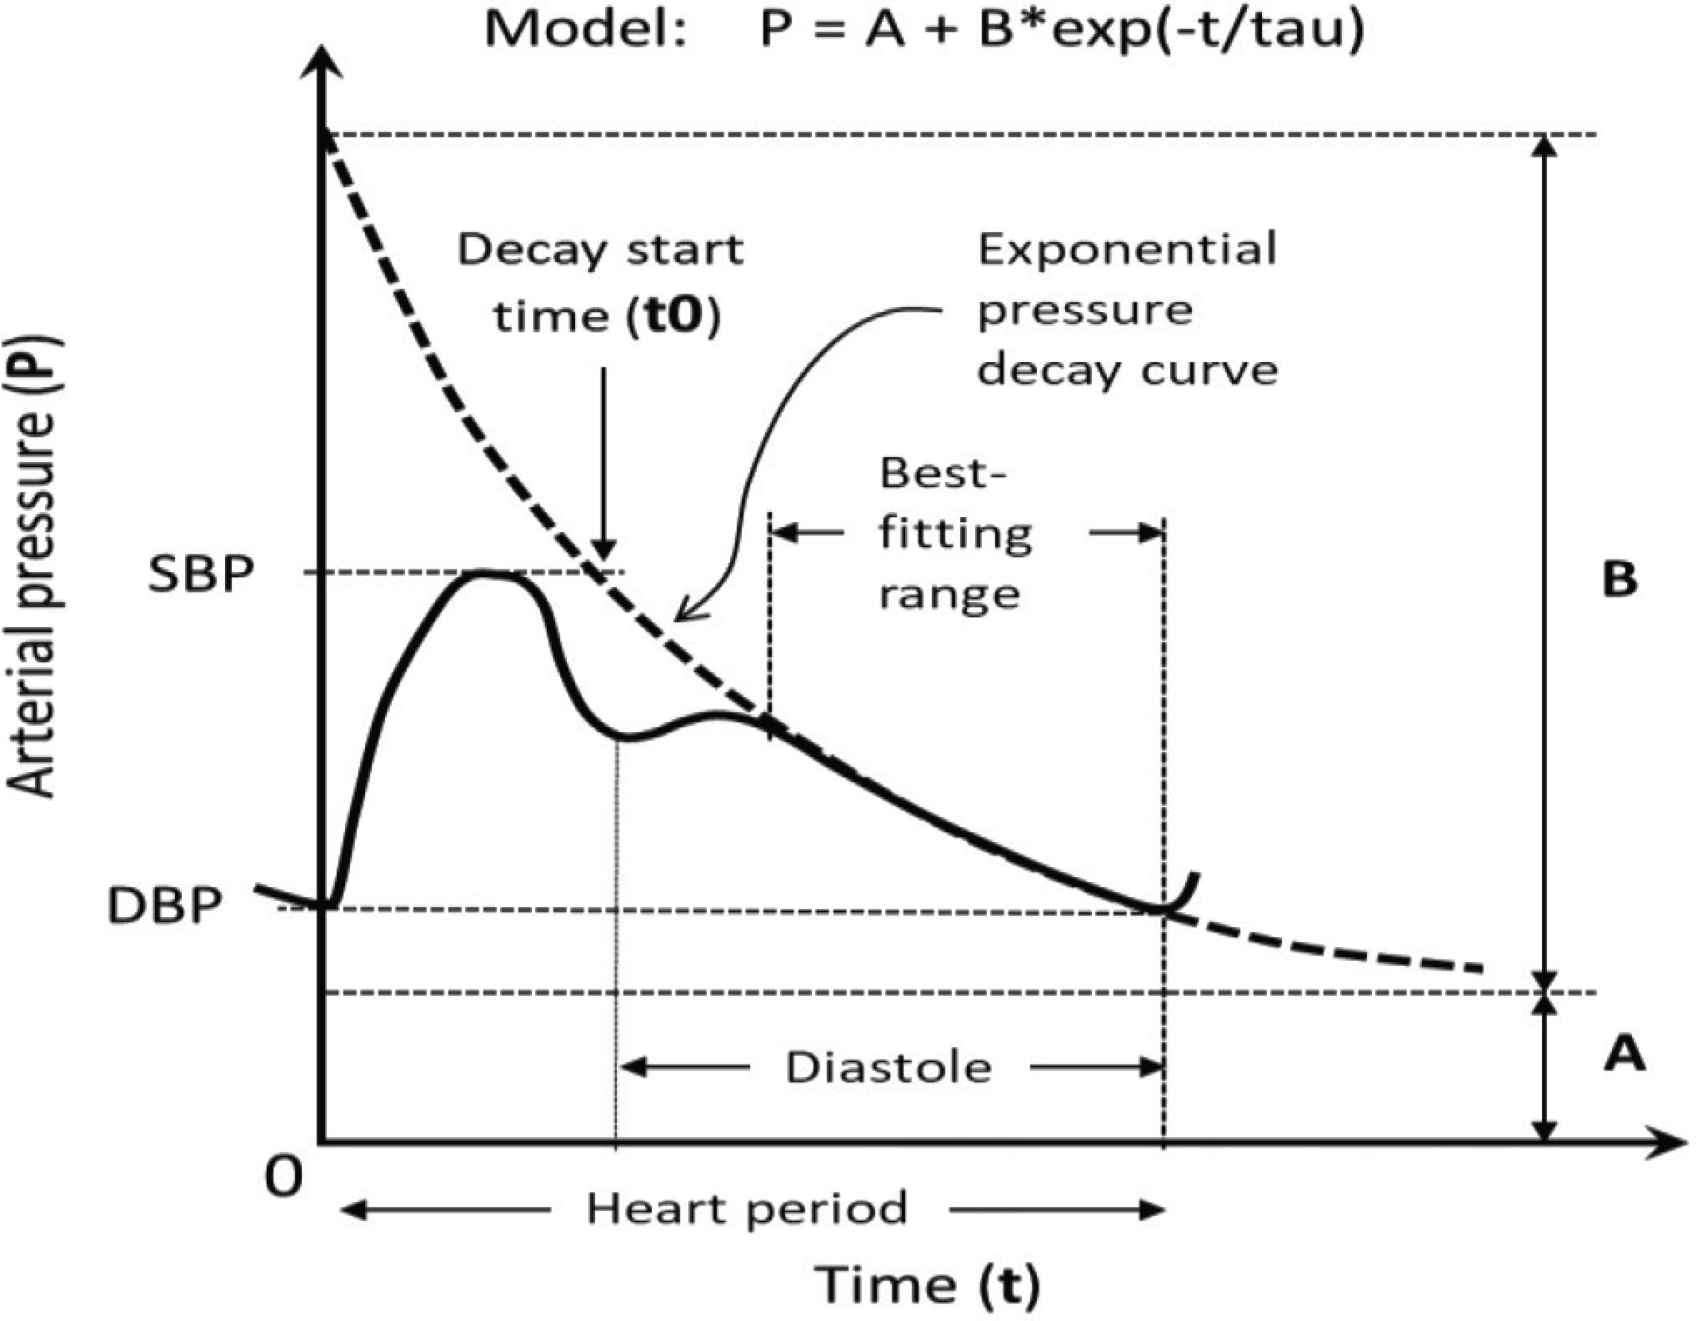
Schematic of pulse contour and model variables. The exponential decay model P = A + (SBP − A)⋅exp(−[t − t0]/tau) was fitted to diastolic pressures at about 20 ms intervals that followed the early diastolic peak; t0 is the start of exponential decay at peak systolic BP (SBP); A is the asymptote representing minimum BP at infinity: DBP is diastolic BP.
2.4. Statistical Analysis
Tau and WK model data for each participant were derived from the individual’s photo-digitized waveform using SYSTAT 12 (SYSTAT Software Inc., San Jose, CA, USA). Further statistical analysis was completed using SPSS-24 (IBM Corp., Armonk, NY, USA), including demographic statistics, Pearson linear regressions and paired t-tests were used to compare tau, blood flow, resistance, arterial compliance, and WK compliance data between the carotid and forearm measurement sites.
3. RESULTS
Tonometry and PWV data were available in 98 individuals; 76 were studied in a comprehensive systemic hemodynamic analysis and a subset of 22 had carotid and radial tonometry with Doppler blood flow studies. Population characteristics are given in Table 1.
| Population characteristics | |||||
|---|---|---|---|---|---|
| n | Min | Max | Mean | SD | |
| Age | 98 | 18 | 91 | 49.7 | 20.1 |
| Weight (kg) | 98 | 48 | 130 | 81.1 | 17.1 |
| Heart rate (bpm) | 97 | 40 | 99 | 65.5 | 12.2 |
| Brachial systolic BP (mmHg) | 98 | 100 | 192 | 134 | 22.5 |
| Brachial diastolic BP (mmHg) | 98 | 51 | 132 | 76.7 | 14.4 |
| Brachial pulse pressure (mmHg) | 98 | 32 | 113 | 57.6 | 15.1 |
| Brachial mean pressure (mmHg) | 98 | 70 | 150 | 96.0 | 16.0 |
| Carotid Tau (ms) | 98 | 76 | 869 | 283 | 125 |
| Carotid t0 (ms) | 98 | 80 | 471 | 265 | 64.4 |
| Carotid A (mmHg) | 98 | 18 | 137 | 69.6 | 16.2 |
| Forearm (radial) Tau (ms) | 98 | 61 | 441 | 199 | 87.5 |
| Forearm (radial) t0 (ms) | 98 | 65 | 489 | 274 | 66.1 |
| Forearm (radial) A (mmHg) | 98 | 46 | 146 | 74.8 | 13.9 |
| Heart-femoral PWV (ms) | 97 | 4.4 | 16.3 | 8.7 | 3.29 |
| Heart-femoral compliance (units) | 97 | 0.0037 | 0.052 | 0.132 | 0.092 |
| Femoral-ankle PWV (ms) | 97 | 5.7 | 21.8 | 10.6 | 2.32 |
| Femoral-ankle compliance (units) | 97 | 0.0021 | 0.031 | 0.0089 | 0.185 |
| Carotid blood flow (mL/min) | 22 | 246 | 1140 | 570 | 215.9 |
| Carotid resistance (mmHg.min/mL) | 23 | 0.1 | 0.4 | 0.185 | 0.0892 |
| Carotid WK compliance (mL/mmHg) | 20 | 0.0055 | 0.0801 | 0.0310 | 0.0170 |
| Forearm (brachial) blood flow (mL/min) | 22 | 21 | 290 | 116 | 83.5 |
| Forearm (brachial) resistance (mmHg.min/mL) | 22 | 0.3 | 3.7 | 1.35 | 1.18 |
| Forearm WK compliance (mL/mmHg) | 19 | 0.0005 | 0.0130 | 0.0041 | 0.00418 |
| Other: 38% were female | |||||
Population characteristics
Figure 2 depicts the age–BP relationship in which systolic BP increased by about 6 mmHg per decade; diastolic BP was related to age as a quadratic (also similar to NHANES III [8]), reaching its highest value in the sixth decade.

Age and blood pressure in the study cohort. This cross-section represented well the range of age (18–91 years) and blood pressure similar to those reported for the U.S. general population [8]. Systolic BP is linear with age while diastolic BP best-fit is a quadratic.
Windkessel model parameters are depicted in Figure 3, including direct comparisons of carotid and radial sites as well as correlations between sites for tau, t0, and A. Upper panels are box and whisker plots that include mean (×), median (central horizontal line), and 95% confidence limits (vertical box). Lower panel demonstrates scatterplots for the model variables and regression equations between carotid and forearm sites. See also Table 1 for discreet values. Carotid tau was about 20% higher than forearm tau and there was no correlation between carotid and forearm values. Carotid t0 was similar to forearm t0 and reasonably well correlated. Carotid A was 5 mmHg less than forearm A but cross-site values were highly correlated.

Modeled variables for carotid and forearm arterial regions. Upper tier represents cross-site comparisons, lower tier represents cross-site regression equations. Boxes represent 95% CI, horizontal lines are median values and × is mean. See Figure 1 and text for explanation of modeled variables.
Figure 4 depicts regional blood flow, resistance, and WK-compliance between carotid and brachial sites. See also Table 1 for discreet values. Carotid blood flow was about fivefold higher than forearm and therefore carotid vascular resistance was about one-fifth of forearm vascular resistance.
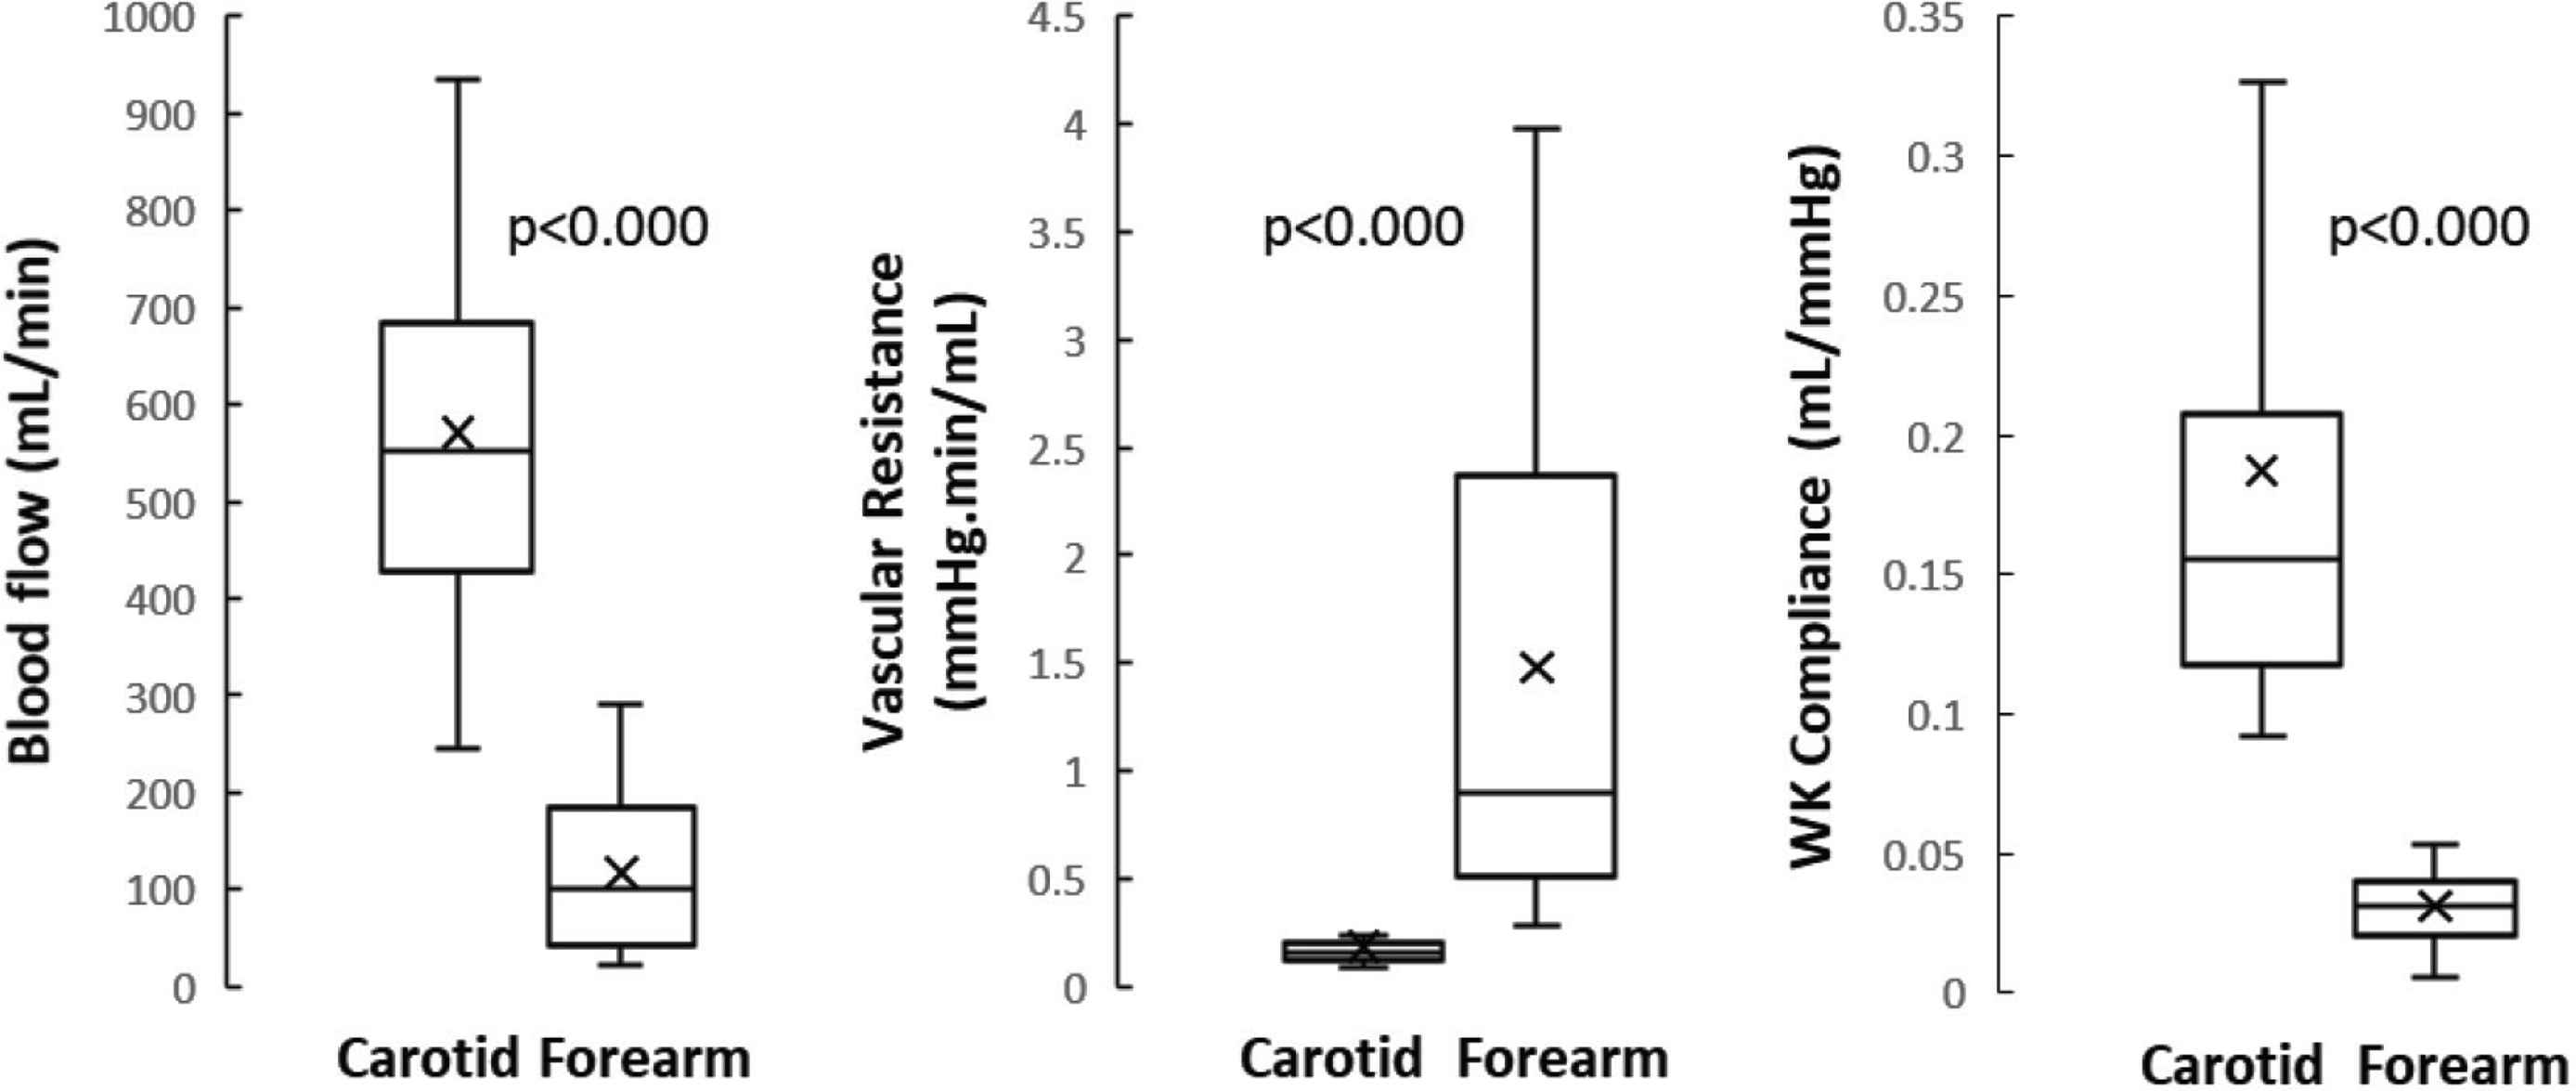
Carotid and forearm blood flow, resistance, and Windkessel-derived regional arterial compliance. Carotid blood flow and corresponding WK compliance were much higher than corresponding forearm values. See Figure 3 for explanation of boxplots.
Table 2 demonstrates that there were no significant correlations between tau values and either heart-femoral or femoral-ankle regional arterial compliance.
4. DISCUSSION
Our results lead to several conclusions. First, our exponential decay model performed well, as evidenced by the fact that the correlation coefficients for each patient were all r > 0.99 in both carotid and forearm arteries. We recognize that demonstrating the presence of exponential pressure decay does not justify the conclusion that an arterial WK actually exists but our data clearly show that tau, a defining WK characteristic, was about 20% higher in the low-impedance carotid circulation than in the high-impedance forearm circulation and that there was no correlation between the tau values from these two arterial regions (r2 = 0.01, pNS). Carotid blood flow was about 5× brachial blood flow and therefore carotid vascular resistance was about one-fifth that of forearm resistance. Together, the associated carotid WK compliance was accordingly about fourfold greater than the corresponding forearm value. Thus, all WK model characteristics in the two regions differed substantially and neither carotid nor forearm tau was related to the PWV or 1/[PWV-squared] values from the central or peripheral arterial regions (heart-femoral and femoral-ankle PWV, respectively). In contrast, the two regional PWV values were well correlated (r2 = 0.39, p < 0.000). Altogether, our findings suggest that there are at least two different types of WKs in the arterial circulation, which in turn implies that a single WK does not adequately represent the entire arterial circulation, and further suggests that whole-body WK modeling in general may not be appropriate. Finally, we can confirm that PWV values from different measurement regions are correlated but cannot be directly substituted for each other.
The inapplicability of a single WK-based circulatory model should not be surprising given the substantial differences in architectural and functional characteristics of the arterial supply to different regions. For simplicity, the arterial circulation can be divided roughly into two types of “circuits”: low-impedance (brain and kidney) and high-impedance (skeletal muscle, splanchnic bed, skin), each of which receives about 40–50% of total blood flow at rest. The architectural characteristics of low- and high-impedance regions differ substantially. Within the brain and kidney, there are relatively short arterial segments with massive “arborization” of the vasculature such that systolic pressure amplification is relatively low. In contrast, the limbs and skeletal muscle are served by long arterial segments with fewer branches, greater impedance, and more prominent systolic pressure amplification [10]. These regional differences informed our choice of arterial measurement sites. Results must also be considered in light of the fact that blood flow patterns can change dramatically during stimulation such as physical exercise [11], where flow to the arm can increase dramatically during exercise, while brain blood flow tends to remain more constant. At the microcirculatory level, there can substantial differences in capillary density, either functionally or anatomically. Thus, any lumped or “whole-body” arterial function indicator is limited in its ability to describe regional circulatory function. Finally, because almost all vascular function indicators are affected by distending pressure and vessel size, as well as wall composition, it must be remembered that arterial function indicators are not constants and should never be interpreted as such [5].
Windkessel models can be questioned on theoretical as well as technical grounds. It has generally been assumed that the onset of the pressure-decay process (t0) begins just after peak systole and lasts until the next cardiac cycle. In reality, however, pressure wave morphology between 100 ms (peak systole) and the midpoint of the cardiac cycle (about 400 ms) is not only affected by pressure decay but also by secondary reservoir pressure waves [12] (formerly mischaracterized as “reflected waves” [13]). We have previously found that this type of pressure wave interference similarly affects a related variable, C1 (defined previously as “large artery compliance”) [5,6,9]. To address this problem, we limited the tau analysis to late diastole, when the interfering secondary pressure waves have been largely attenuated in most individuals. However, the inclusion of a minimum modeled pressure (A, which is P at t = infinity) is also required because of persisting interference of secondary pressure waves in some individuals and a late diastolic pressure dip in others.
In summary, (1) tau and WK compliance should be considered to be regional, not systemic properties; (2) regional WK compliance is not closely related to large artery stiffness determined by point-to point methods in roughly analogous arterial regions; and (3) a single WK model cannot adequately describe the arterial circulation.
CONFLICTS OF INTEREST
The authors declare they have no conflicts of interest.
AUTHORS’ CONTRIBUTION
JLI is responsible for all aspects of the study. Study conceptualization and data analysis were carried out by BG. PJO contributed in data acquisition and analysis. Data analysis were carried out by MAA and SE.
ACKNOWLEDGMENT
The authors wish to thank Saba Asif for help with data acquisition.
DISCLOSURES
None pertinent to this work. Dr. Izzo has received research grants from AstraZeneca, Boehringer-Ingelheim, Novartis and Sanofi.
Footnotes
REFERENCES
Cite this article
TY  - JOUR
AU  - Joseph Lewis Izzo
AU  - Muhammed Absar Anwar
AU  - Sherif Elsayed
AU  - Peter John Osmond
AU  - Benjamin Gavish
PY  - 2019
DA  - 2019/12/24
TI  - Dissociation of Carotid and Forearm Pressure Decay Constants (tau), Windkessel Compliances, and Pulse Wave Velocities: Implications for Circulatory Models
JO  - Artery Research
SP  - 165
EP  - 169
VL  - 25
IS  - 3-4
SN  - 1876-4401
UR  - https://doi.org/10.2991/artres.k.191210.002
DO  - 10.2991/artres.k.191210.002
ID  - Izzo2019
ER  -