
Cardio-Ankle Vascular Index is a predictor of cardiovascular events
- DOI
- 10.1016/j.artres.2011.03.005How to use a DOI?
- Keywords
- CAVI; Cardiovascular events; Atherosclerosis
- Abstract
Introduction: The Cardio-Ankle Vascular Index (CAVI) was established as a parameter of atherosclerosis that does not depend on a subject’s blood pressure, and is now used in many centers. However, it remains unclear whether the CAVI can predict the development and outcome of cardiovascular disease.
Methods: CAVI was measured as a parameter of atherosclerosis in 400 patients between January 1 and December 31, 2006. The 400 patients were classified into 3 groups according to the CAVI score: Groups A (CAVI < 9), B (9 ≤ CAVI < 10), and C (CAVI ≥ 10).
Result: The cumulative incidences of cardiovascular diseases and stroke were higher in Group C than in Group A and the log-rank test revealed a statistically significant difference between these groups (p < 0.05). A multivariate analysis showed that the hazard ratio of cardiovascular diseases was significantly higher in Group C (hazard ratio, 2.2).
In conclusion, CAVI is a useful parameter of atherosclerosis in high-risk patients and is an accurate predictor of patients at a higher risk for cardiovascular diseases.
- Copyright
- © 2011 Association for Research into Arterial Structure and Physiology. Published by Elsevier B.V. All rights reserved.
- Open Access
- This is an open access article distributed under the CC BY-NC license.
Introduction
The pulse wave velocity (PWV) is a parameter of atherosclerosis that is measured using several methods. Aortic PWV, which is measured between the carotid and femoral arteries, is associated with the prognosis and onset of cardiovascular disease,1–4 and is an established parameter of atherosclerosis.5–8 While the brachial-ankle PWV (baPWV), which is readily measured between the brachial and ankle arteries, is significantly affected by blood pressure during measurement.9–13 One limitation of the baPWV is that this parameter reflects both elastic arterial stiffness, and muscular arterial stiffness.14 There are very few follow-up studies examining the association between baPWV and the development of cardiovascular disease. Therefore, the Cardio-Ankle Vascular Index (CAVI) was developed as a parameter of atherosclerosis that does not depend on the blood pressure. The CAVI is noninvasively measured between the brachial and ankle arteries, similarly to baPWV, and is calculated using the conventional baPWV.15 Furthermore, the CAVI has a high-level of reproducibility and does not depend on the blood pressure during measurement.16–18 Several studies have examined the association between the CAVI and atherosclerosis.9,19,20 However, no prospective studies have revealed an association between the CAVI and cardiovascular disease. In addition, the predictive ability of the CAVI for the development and outcome of cardiovascular diseases is poorly characterized. Therefore, the present prospective study investigated the association between the CAVI and the prognosis of patients with cardiovascular disease.
Methods
Subjects
This is a single center analysis. The hospital is general municipal hospital located in Tokyo, Japan. Many emergency patients are admitted to the hospital. The CAVI was measured as a parameter of atherosclerosis progression for patients with hypertension, diabetes, dyslipidemia or a past history of cardiovascular disease at the Department of Internal Medicine and Cardiology and Cardiovascular surgery. Four hundred eighty-eight patients underwent CAVI measurements between January and December, 2006 after providing their written informed consent. Four hundred Japanese adult subjects were enrolled (252 male subjects, 148 female subjects); however, 28 participants with a past history of myocardial infarction, stroke, percutaneous coronary intervention (PCI) for angina, or coronary artery bypass grafting (CABG) for ischemic heart disease, and 60 subjects with an ABI of less than 0.9 were excluded from the present series.21,22
The present study examined the association between CAVI and the prognosis of cardiovascular disease. This study obtained approval from the ethics committee’s approval. The purpose of the study was explained to all patients who participated in this study. In addition, all patients had the right to refuse to participate in this study.
Follow-up
The subjects were followed-up at intervals of 1–2 months in the outpatient department from January 2006 through December 2008. The patients’ health status was checked during each follow-up, and was recorded using electronic clinical records. All cardiovascular events were verified on the electronic clinical record in. The outcomes of the present analyses included new events of coronary artery disease, stroke and total cardiovascular events (coronary artery disease and stroke).
Definition of cardiovascular events
Cardiovascular disease (CVD) was defined as coronary artery disease, stroke and death. Coronary artery disease was defined as those with acute coronary syndrome and ischemic heart disease, who were treated by PCI or CABG. Acute coronary syndrome was defined as having a symptom such as chest pains, ST segment elevation ≥1 mm in 2 or more contiguous leads subtending the damaged area in the electrocardiogram, local wall motion asynergy of the left ventricular wall in the transthoracic echocardiography or increasing myocardial deviating enzymes (Creatinine Kinase > 200 and troponin T > 0.10) on a blood test. PCI events were defined as the first PCI associated with angina as identified by myocardial ischemia in an electrocardiogram or by scintigraphy.
Stroke was defined as a sudden onset of nonconvulsive and focal neurological deficit, and either cerebral infarction or brain hemorrhage was identified based on images via computed tomography and magnetic resonance imaging.
CAVI
In Fig. 1, CAVI was measured in a similar manner as baPWV and was calculated using the following equation, and reflected arterial stiffness according to Bramwell-Hill’s formula: CAVI = ln(Ps/Pd) × (PWV)2/(ΔP/2ρ) (ln: natural log, Ps: systolic blood pressure, Pd: diastolic blood pressure, PWV: pulse wave velocity, ΔP: Ps−Pd, ρ: blood density).15
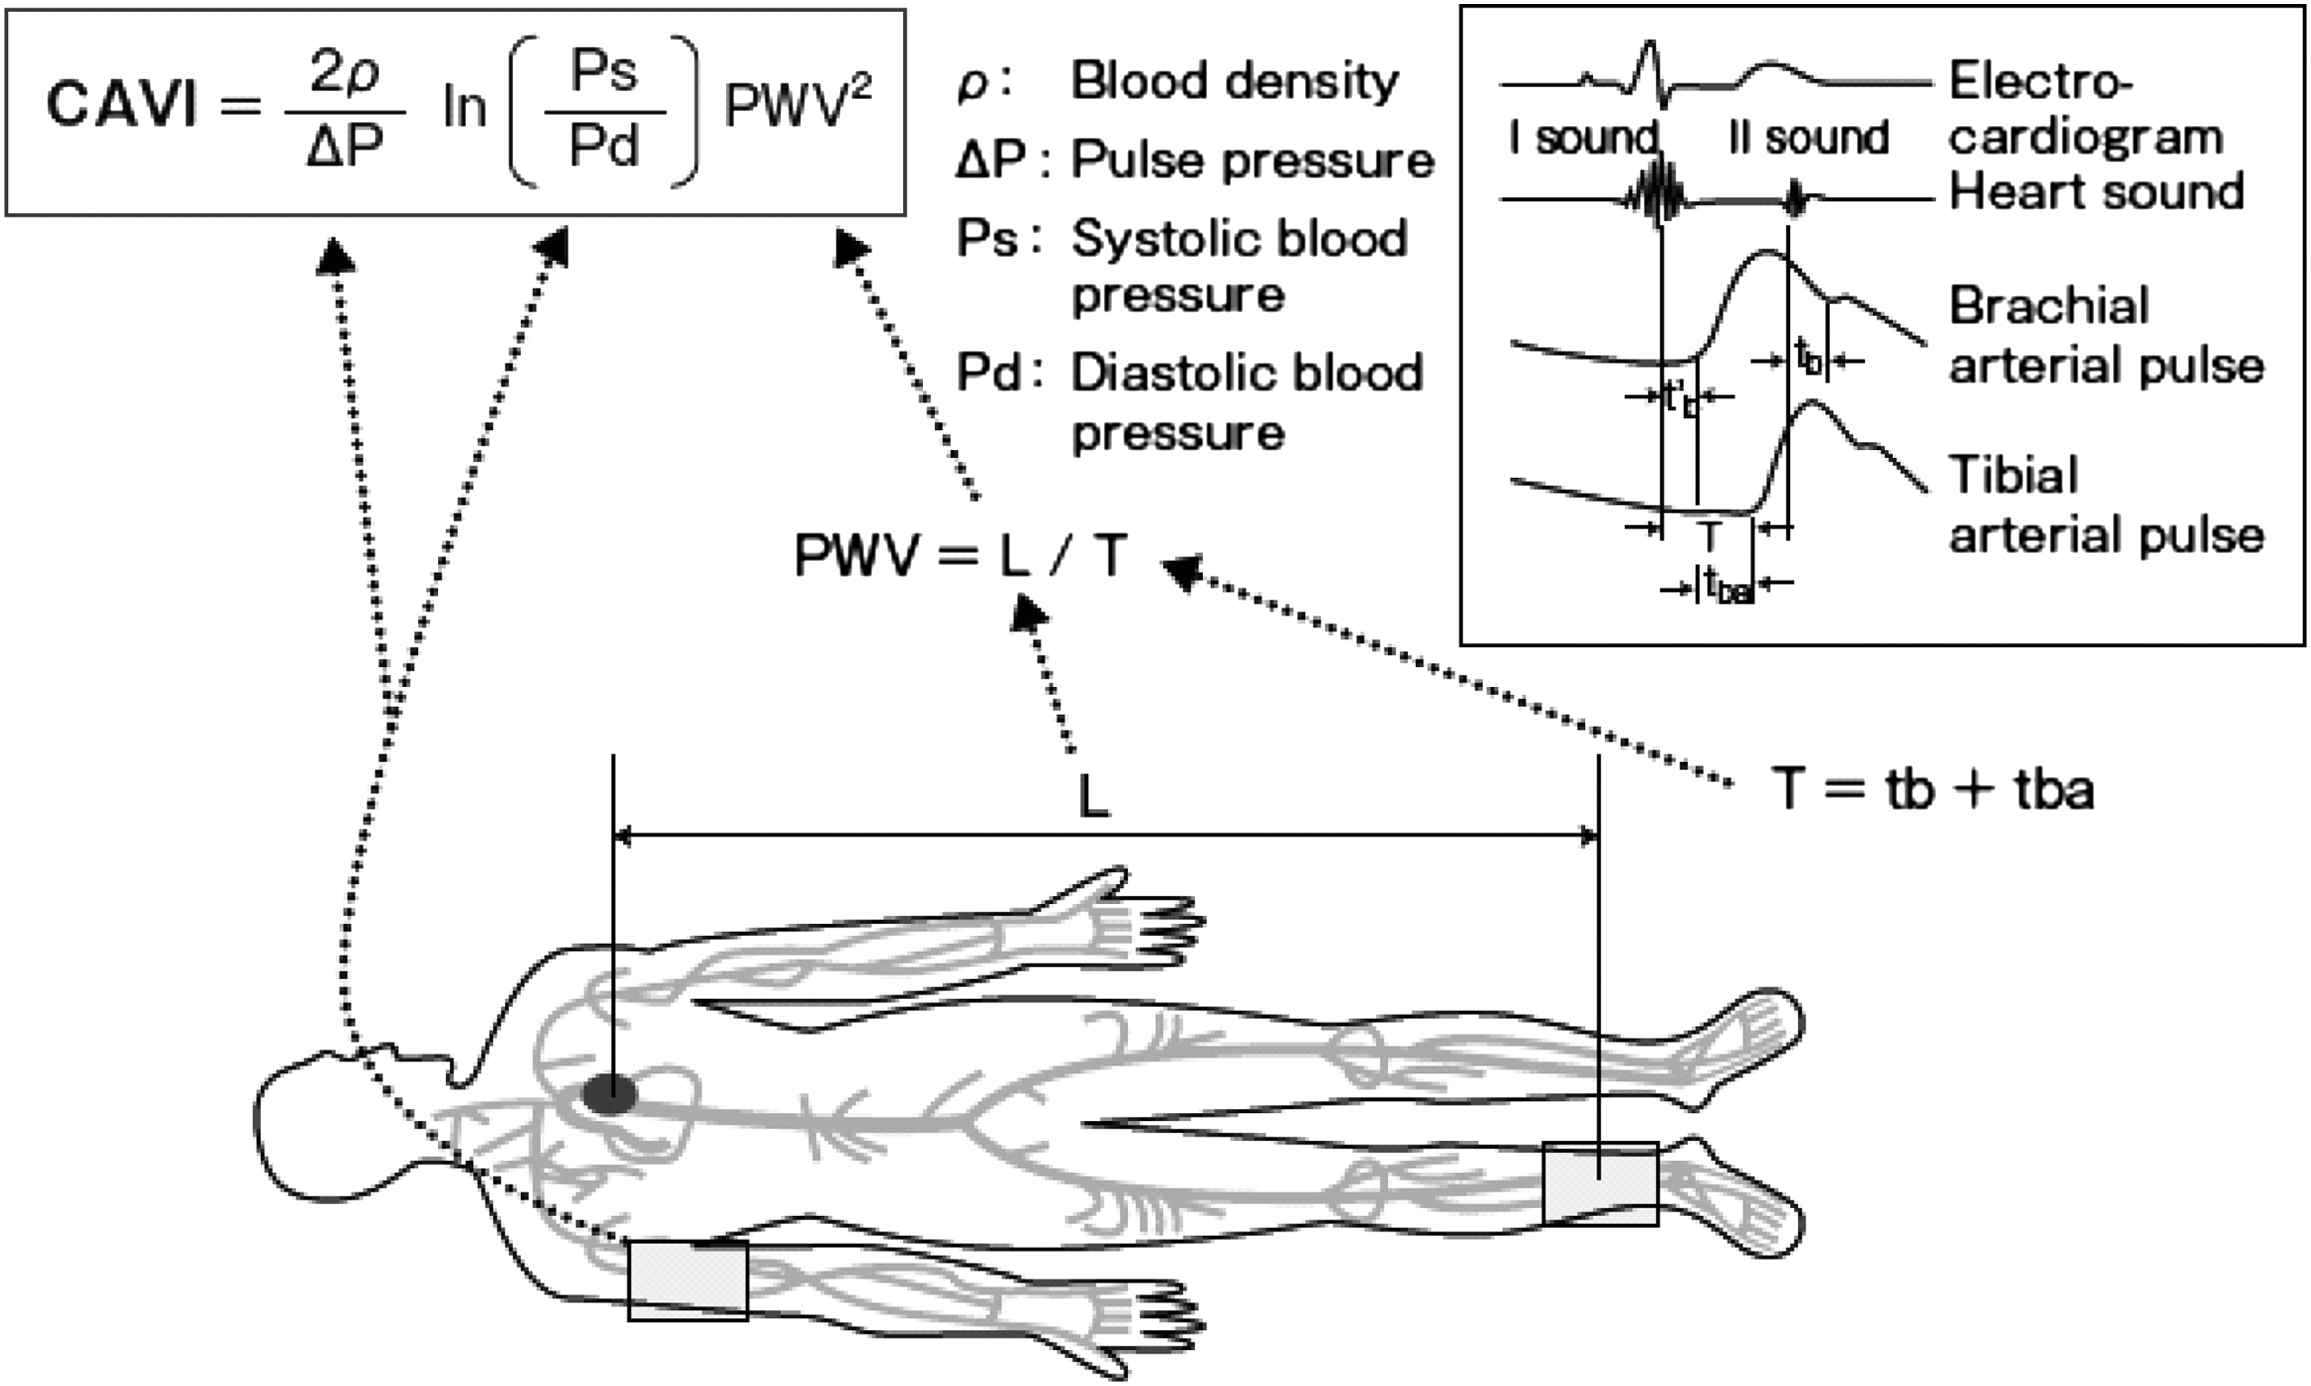
CAVI and its measurement. Patients were placed in a supine position. Electrocardiogram and hearts sound were monitored. PWV from the heart to the ankle was obtained by measuring the length from the aortic valve to the ankle, and by T = tb + tba. The blood pressure was measured at the brachial artery. Ps: systolic blood pressure, Pd: diastolic blood pressure, PWV: pulse wave velocity, ΔP: Ps-Pd, ρ: blood density, L: length from Aortic Valve to Ankle, T: time taken for the pulse wave to propagate from the aortic valve to the ankle, tba: time between the rise of brachial pulse wave and the rise of ankle pulse wave, tb: time between the aortic valve’s opening sound and the rise of the brachial pulse wave.
CAVI was obtained by substituting the stiffness parameter β in the following equation for determining vascular elasticity and PWV. The stiffness parameter indicates BP-independent patient-specific vascular stiffness as measured by arterial ultrasound. The stiffness parameter β is calculated by the formula: Stiffness parameter β = ln (Ps/Pd) × (D + ΔD)/ΔD. D is the diameter of blood vessel and ΔD is the change in D.23 Therefore, the stiffness parameter β (and CAVI) represents the local stiffness of a blood vessel and it is also independent of blood pressure.
Measurement of the CAVI
The CAVI was recorded using a VS-1000 (Fukuda Denshi, Tokyo, Japan) with the patient in a supine position after 5 min of rest. ECG electrodes were placed on both wrists, a microphone for detecting heart sounds was placed on the sternum, and cuffs were wrapped around both the arms and ankles.
The blood pressure and the pulse wave were measured by pressurizing four points at the same time. Moreover, the phonocardiogram was measured at the same time on 2 left sternal borders, and the time from the 2 sounds (close to the aortic valve) to the attainment of the pulse wave was measured. (Fig. 1)15,23 The averages of the right and left CAVI values were used for the analyses.
The cut-off levels of the CAVI were unclear for estimating atherosclerosis because using the CAVI is still a relatively new method. A CAVI value of ≥9.0 or greater was reported to significantly predict the presence of the coronary artery stenosis using an ROC curve.19,23 Therefore, the cut-off point was defined as a CAVI value of 9 and 10, in the present study.
Relevant factors
The pulse rate and blood pressure were measured at rest, simultaneously with the measurement of CAVI. Height and weight were measured at the time of CAVI measurement, and the body mass index (BMI: kg/m2) was calculated as an index of obesity. Blood samples were collected from a vein within a month of the time of CAVI measurement. Hypertension was defined as a systolic blood pressure of equal or greater than 140 mm Hg, a diastolic blood pressure of equal or greater than 90 mm Hg or the current use of antihypertensive agents.
Dyslipidemia was defined as total cholesterol (TC) ≥ 5.69 mmol/L, low-density lipoprotein-cholesterol (LDL-C) ≥ 3.62 mmol/L, high-density lipoprotein-cholesterol (HDL-C) < 1.04 mmol/L or the current use of lipid-lowering drugs. Diabetes mellitus was defined by hemoglobin A1c (HbA1c) ≥ 6.5% or the use of hypoglycemic agents. Chronic kidney disease (CKD) was defined as a glomerular filtration rate (GFR) ≤ 60 ml/min/1.73 m2. GFR was estimated using the simplified prediction equation derived from the Modification of Diet in a Renal Disease study.
Statistical analysis
The SPSS software package ver. 13.0 was used for the statistical analyses. The 400 patients were classified into 3 groups according to the CAVI : Groups A (CAVI < 9), B (9 ≤ CAVI < 10), and C (CAVI ≥ 10).15,19,23 Differences among the groups were analyzed by the Cochran Mantel–Haenszel test. Survival curves were made by employing the Kaplan–Meier method, and differences in the survival rate among groups were analyzed using the log-rank test. The relative risk in each group was calculated using a Cox regression analysis, and p-values of less than 0.05 were considered to be statistically significant.
Results
The mean follow-up period was 27.2 ± 4.6 months. Cardiovascular diseases occurred in 49 patients (17 coronary artery disease events, 32 strokes, no death). The baseline characteristics of the patients are shown in Table 1. The age, BMI and hypertension in group C were significantly different than in group A. The patients had a high prevalence of hypertension (mean, 55.5%), dyslipidemia (53.0%), diabetes mellitus (58.2%) and CKD (41.2%). Therefore, the subjects of this study constituted a group at high-risk for cardiovascular diseases. Statin and antihypertensive agents were taken by 39.6%, while 45.1% received medication.
| CAVI | Group A (N = 154) | Group B (N = 132) | Group C (N = 114) |
|---|---|---|---|
| <9.0 | 9.0–10.0 | 10.0≤ | |
| Men (%) | 64.2 | 59.9 | 64.9 |
| Age* | 63.2 ± 13.2 | 70.6 ± 8.5 | 73.9 ± 9.0 |
| Follow-up (months) | 27.4 ± 7.8 | 27.3 ± 8.3 | 26.8 ± 8.9 |
| BMI (kg/m2)* | 24.7 ± 4.8 | 23.5 ± 3.5 | 22.2 ± 3.2 |
| Smoking (%) | 23.7 | 17.7 | 17.8 |
| SBP (mm Hg)* | 132.8 ± 19.9 | 134.9 ± 17.5 | 142.3 ± 18.8 |
| Hypertension (%)* | 43.1 | 52.1 | 71.2 |
| Dyslipidemia (%) | 55.9 | 52.3 | 50.8 |
| Diabetes Mellitus (%) | 56.1 | 61.2 | 57.2 |
| CKD (%) | 28.6 | 46.0 | 49.0 |
| Statin (%) | 38.8 | 39.2 | 40.7 |
| Antihypertensive agents (%) | 35.5 | 49.2 | 50.8 |
P value < 0.01 vs CAVI < 9.0.
Values are presented as the mean ± standard deviation.
SBP: systolic blood pressure, BMI: body mass index, CKD: chronic kidney disease.
Baseline Characteristics of the Patients according to the CAVI group.
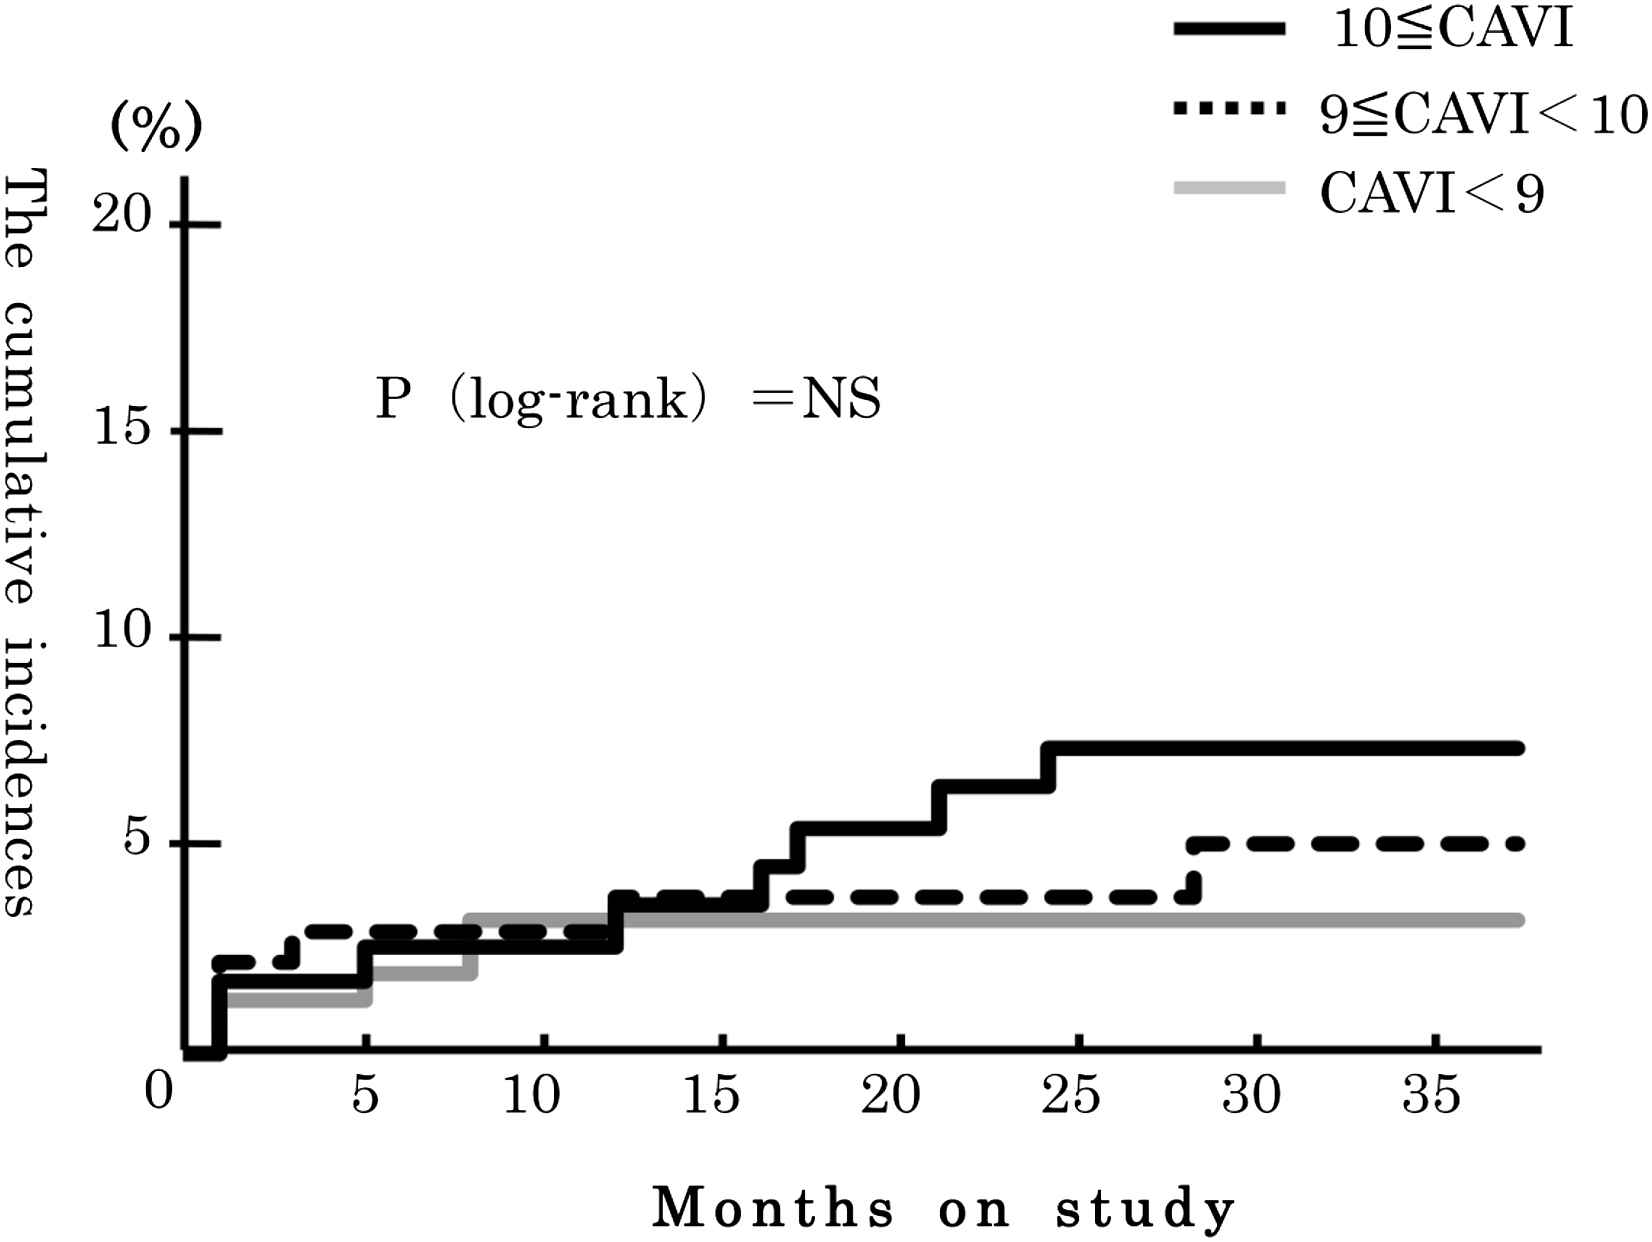
Fig. 2 shows the cumulative incidence of coronary artery diseases according to CAVI group. The cumulative incidence was highest in group C, but, there were no significant differences among 3 the groups. The cumulative incidence of stroke showed similar results (Fig. 3). Fig. 4 shows the cumulative incidence of all cardiovascular disease (CVD, coronary artery disease and stroke). The cumulative incidence of CVD was significantly higher in the group C than in the group A (p < 0.05).
The cumulative incidence of coronary artery diseases. The cumulative incidence of the highest CAVI group was highest among the 3 groups, but, there were no significant differences among the 3 groups.

The cumulative incidence of stroke. The cumulative incidence of the highest CAVI group was highest among the 3 groups, but, there were no significant differences among the 3 groups.

The cumulative incidence of coronary artery diseases and strokes. The cumulative incidence of all cardiovascular disease (coronary artery disease and stroke) was significantly higher in group C than in group A (p < 0.05).
The hazard ratios (HRs) for cardiovascular disease incidence were evaluated for group A versus group C after adjusting for sex and age (Table 2). An increase in CAVI increased the incidence of CVD and the sex- and ageadjusted HRs of incidence of CVD in group C in comparison to group A was 2.11 [95% CI, 1.02–4.38]. In addition, these associations remained after adjusting for age, sex, smoking, hypertension, diabetes mellitus, dyslipidemia and chronic kidney disease as risk factors of cardiovascular diseases (Table 2). The multivariate-adjusted HRs of the incidence CVD in group C in comparison to group A was 2.25 [95% CI, 1.02–4.95] (Table 2). Age, smoking, and hypertension were significantly associated with the univariate-adjusted HRs of the incidence of CVD (Table 3).
| CAVI | Group A | Group B | Group C | P Value for Trend |
|---|---|---|---|---|
| <9.0 | 9.0–10.0 | ≤10.0 | ||
| Person-years of follow-up | 154 | 132 | 114 | |
| Numbers of cardiovascular diseases | 13 | 16 | 20 | |
| Adjusted HR (95% CI)a | 1 [Reference] | 1.47 (0.70–3.08) | 2.11 (1.02–4.38) | 0.04 |
| Multivariate HR (95%CI)b | 1 [Reference] | 1.38 (0.65–2.97) | 2.25 (1.02–4.95) | 0.04 |
CI, confidence interval; HR, hazard ratio.
Adjusted for sex and age.
Adjusted for sex, age, smoking, hypertension, diabetes mellitus, dyslipidemia and chronic kidney disease.
The hazard ratios for cardiovascular disease (coronary artery disease and stroke).
| HR (95%CI) | P Value for Trend | |
|---|---|---|
| Sex | 0.81 (0.46–1.44) | 0.48 |
| Age | 1.04 (1.01–1.07) | 0.02 |
| Smoke | 0.25 (0.08–0.81) | 0.02 |
| Hypertension | 2.47 (1.23–4.97) | 0.01 |
| Dyslipidemia | 0.66 (0.37–1.17) | 0.16 |
| Diabetes mellitus | 1.25 (0.62–2.51) | 0.53 |
| Chronic Kidney Disease | 1.93 (1.07–3.47) | 0.03 |
CI, confidence interval; HR, hazard ratio.
The hazard ratios of other risk factor for cardiovascular disease.
Discussion
The present study demonstrated that a higher CAVI value was a significant predictor of total cardiovascular disease. In particular, the risk of cardiovascular diseases in the group with a CAVI ≥ 10.0 was approximately 2-fold higher than that in the group with a CAVI < 9.0. This association remained statistically significant after controlling for age, sex, hypertension, diabetes, dyslipidemia, and chronic kidney disease.
Several studies have reported an association between the CAVI and atherosclerotic diseases. Shirai et al. reported the CAVI values from patients with hemodialysis are higher in comparison the patients without hemodialysis.15 Nakamura et al. found the CAVI has a significantly and stronger association with the presence and severity of coronary atherosclerosis than carotid atherosclerosis parameters, such as the intima-media thickness.19 Other studies have revealed a high CAVI in patients with a history of PCI or cerebrovascular events and demonstrated a correlation between the CAVI and the severity of coronary stenotic lesions, thus suggesting an association between organic lesions and a high CAVI. However, these reports were cross-sectional studies; no prospective study has so far examined the association between the CAVI and cardiovascular disease. The present study is the first to examine this issue and clearly demonstrates that a higher CAVI value is predictive of the incidence of cardiovascular disease.
PWV is used as an index of arterial stiffness, and PWV is predictive for the development of cardiovascular disease. Although aortic PWV has several drawbacks, such as being a cumbersome procedure, baPWV can be easily measured. However, few reports have previously reported that baPWV can predict future cardiovascular events, because baPWV, has several considerations, such as the effects of blood pressure during measurement. In the present study, we used CAVI rather than PWV as an index of arterial stiffness.
In addition, baPWV is calculated by measuring the velocities of a pulse wave from the distal portion of the aorta to the ankle arteries. Therefore, baPWV reflects both the aortic stiffness and the stiffness of the peripheral muscular arteries. baPWV is dependent on blood pressure because of the target muscular arteries for the measurement. However, the CAVI also includes these different properties, but the measurement area is from the aortic valve to the ankle. A study examining target muscular arteries and the elasticity of vessels for these measurements demonstrated that CAVI evaluates the qualitative change in the blood vessel mechanism and functional changes, such as the accentuation of the blood vessel tonus with sympathetic nerve tension. The advantage that the blood pressure does not affect CAVI in comparison to baPWV may yield better measurement reproducibility.10–17 Therefore, the current findings suggest that the CAVI is an appropriate modality for screening examinations.
The CAVI is thought to reflect arterial compliance. Atherosclerosis is characterized by both atheroma formation in the intima and wall hardening in the media. Intimal changes induce plaque rupture, which is closely associated with the development of cardiovascular disease. Medial hardening reduces arterial compliance, and has various effects on hemodynamics and the progression of atherosclerosis.
There are several limitations associated with the present study. First, the number of subjects was limited. This study was performed at a single institution and only a small number of subjects were included. The subjects were in a high-risk patient population, and were Japanese participants who were outpatients at this institution. The study examined high-risk patients for cardiovascular disease events. Therefore, larger-scale studies will be performed in the future to examine the general population. Second, the findings are based on a one-time CAVI measurement, which may not accurately reflect the status of the study participants. However, the CAVI shows high-level reproducibility, as we described earlier. In addition, this source of variability could not account for the relationship observed in the present study, because a random misclassification tends to underestimate the risk. Therefore, the true association may even be stronger than that observed in the current series.
Conclusions
The present study found a higher CAVI to be an independent predictor of cardiovascular disease in a high-risk patient population, thus suggesting that the CAVI is a useful parameter of atherosclerosis in high-risk patients and it is an accurate predictor of cardiovascular diseases. In addition, the results demonstrated that patients with a CAVI of 10 or greater had a significantly risk for the development of cardiovascular disease, thus suggesting that the highest cut-off level for the CAVI may be 10.0.
Conflict of interest
The authors declare no conflict of interest.
References
Cite this article
TY  - JOUR
AU  - Yoshiaki Kubota
AU  - Daisuke Maebuchi
AU  - Makoto Takei
AU  - Yumiko Inui
AU  - Yuumi Sudo
AU  - Yukinori Ikegami
AU  - Jun Fuse
AU  - Munehisa Sakamoto
AU  - Yukihiko Momiyama
PY  - 2011
DA  - 2011/06/08
TI  - Cardio-Ankle Vascular Index is a predictor of cardiovascular events
JO  - Artery Research
SP  - 91
EP  - 96
VL  - 5
IS  - 3
SN  - 1876-4401
UR  - https://doi.org/10.1016/j.artres.2011.03.005
DO  - 10.1016/j.artres.2011.03.005
ID  - Kubota2011
ER  -