
Central and peripheral pulse wave velocities are associated with ankle–brachial pressure index
- DOI
- 10.1016/j.artres.2011.08.003How to use a DOI?
- Keywords
- Pulse wave velocity; Arterial stiffness; Vascular disease; Atherosclerosis; Ankle–brachial index
- Abstract
Background: Central Pulse Wave Velocity (PWV) is considered to be the gold standard measurement of arterial stiffness. In healthy subjects, cardiovascular risk factors such as age, hypertension, diabetes and end-stage renal disease are associated with increased central (Carotid–Femoral) and peripheral (Femoral–Ankle) PWV. However, little is known about PWV in patients with peripheral arterial disease and pathological Ankle–Brachial Index (ABI). The aim of this study was to study central and peripheral PWV in a population with various degree of peripheral arterial disease.
Methods: Central and peripheral PWV were measured in sixty-two hospitalized patients. Half were admitted for symptomatic peripheral vascular disease and the remainder for cardiac or carotid disease. The population was classified on basis of the Framingham-derived risk score for claudicants and on the ABI. For all patients, PWV was assessed on electrocardiogram-ultrasonographic images acquired at the four following sites: carotid, radial, femoral and tibial arteries.
Results: Carotid–Femoral PWV increased significantly with the Framingham-derived global risk score (p < 0.0001) but Femoral–Ankle PWV did not. With respect to the Ankle–Brachial Index, Carotid–Femoral and Femoral–Ankle PWV significantly increased (p = 0.05 and p = 0.02 respectively) with the severity of peripheral arterial scoring.
Conclusions: These results confirm that central PWV is the best indicator of general atherosclerosis, even in the presence of peripheral arterial disease. Both central and peripheral PWV can be considered as indicators of the severity of peripheral vascular disease.
- Copyright
- © 2011 Association for Research into Arterial Structure and Physiology. Published by Elsevier B.V. All rights reserved.
- Open Access
- This is an open access article distributed under the CC BY-NC license.
Introduction
Pulse Wave Velocity (PWV), the speed of propagation of arterial pressure waves through the arterial tree, is directly related to the arterial stiffness.1
Carotid–Femoral PWV (also known to as central PWV) is considered as the gold standard measurement of arterial stiffness. Age, hypertension, diabetes and end-stage renal disease are associated with an increased central stiffness.2 Central PWV has been recognized as an independent risk factor for cardiovascular morbidity and mortality.3 It has also been associated with the presence of radiological markers of atherosclerosis in the aorta (femoral plaque and intima-media thickness-IMT), as well as in the carotid (carotid plaque and IMT) and coronary arteries (coronary artery calcification-CAC score).4
PWV has also been studied on other arterial sites (Carotid–Radial, Femoral–Ankle and Brachial–Ankle). In healthy subjects, Brachial–Ankle PWV correlated with Carotid–Femoral PWV and have shown similar association with cardiovascular risk factors.5–7 The Femoral–Ankle PWV is usually referred to as peripheral PWV. It also showed association with cardiovascular risk factors6,7 in healthy subjects. However, Tillin et al.4 did not find any significant association between Femoral–Ankle PWV and the radiological markers of atherosclerosis (femoral plaque and IMT, carotid IMT and CAC score) in a population of clinically and non-clinically coronary-diseased patients. They suggested a different mechanical behaviour between elastic (central) and predominantly muscular (peripheral) arteries.4 Benetos et al.8 confirmed this hypothesis, showing in a hypertensive population that the common carotid artery was highly compliant despite strong alterations of its viscoelastic properties with age. On the contrary, the femoral artery was less compliant, with little influence of age and high blood pressure.
In clinical practice, PWV is usually determined by measuring the propagation of pulse pressure from the carotid to the femoral arteries. These pressure pulses are recorded simultaneously or sequentially either with tonometric sensors or with mecanotransducers3 and the electrocardiogram (ekg) is used as the time reference in sequential measurements.
Doppler signals from the carotid and femoral arteries have been proposed in place of these methods of pressure pulse capture to measure PWV.9 Jiang et al.10 have demonstrated that the flow velocity waveforms recorded by Doppler ultrasound can be used with similar reproducibility to standard tonometric systems. Thought not widespread, this method allows analysis on deeper or more calcified arterial segments that are not appropriate for valid tonometer signal detection. Systems in use also differ with respect to the calculation algorithm for the pulse propagation time: foot of the pulse wave, point of maximum upstroke or intersecting tangent. A substantial difference between values of PWV has been pointed out by Millasseau,11 attributable to the method of transit time calculation.
The aim of this work was to study PWV on four arterial segments (Carotid–Femoral, Carotid–Radial, Carotid–Ankle, Femoral–Ankle) in a population with various degree of severity for peripheral vascular disease. Half of patients were suffering from peripheral arterial disease, while the other half was suffering from cardiac or carotid disease. We did not intend to compare the population depending on the clinical criteria of claudication, which could be considered as subjective, but rather on the objective severity of arterial disease, as assessed by the ABI. We also defined the cardiovascular risk factors of our population by using a Framingham Study-derived score adapted for claudicants.12
Methods
The study was performed on a total of sixty-two hospitalized patients (45 men and 17 women) with a mean age 71.9 years (range 48–89). Thirty-one patients were admitted for symptomatic peripheral vascular disease, 9 for coronary artery bypass grafting, 10 for valvular cardiac disease and 12 for carotid endarterectomy. All subjects provided informed consent and the study was approved by the Institutional Ethics committee.
We firstly classified the whole population on a cardiovascular risk score defined by the intermittent claudication risk profile extracted from the Framingham Heart study.12 This scoring takes into account the following predictors: coronary heart disease, diabetes, hypertension, gender, age, serum cholesterol and cigarette smoking. Depending on the global risk factor points, the 4-year probability of intermittent claudication is estimated on basis of a correlation table. This scoring is suited to our study as it considers the main cardiovascular risk factors and is adapted to study peripheral arterial disease. We considered four categories of severity in order to represent quartiles of the whole cohort (Table 1).
| Categories | Framingham risk score |
|---|---|
| 1 | ≤8 |
| 2 | 9–10 |
| 3 | 11–13 |
| 4 | 14–17 |
| Categories | Ankle–Brachial Index |
|---|---|
| 1 | ≥0.9 |
| 2 | 0.8–0.89 |
| 3 | 0.6–0.79 |
| 4 | <0.6 |
Framingham-derived risk score and Ankle–Brachial Index score values by category.
In a second analysis, we assessed the Ankle–Brachial Index to characterize the severity of the peripheral arterial disease of our population.13–15 We also used four categories of severity, as described in the literature and commonly used in clinical practice15 (Table 1).
All subjects were examined in supine position, after a resting period of 5 min. The ABI was measured by means of a Doppler probe (Bidop ES-100V3, Hadeco®, Kawasaki, Japan). PWV was assessed by the “ekg-ultrasonographic” method for all patients: a sequential recording of the Doppler signal at four arterial levels was performed using the ekg time reference. Electrodes of electrocardiogram were placed on both wrists and on one ankle. B-mode, colour and pulsed Doppler measurements were performed using an ultrasound machine (IE33 xMatrix system, Ultrasound Machine, Philips®, Drachten, The Netherlands) equipped with a 9-3 MHz transducer. Mean velocity waveforms were recorded on 4 sites over at least 5 cardiac cycles: common carotid and common femoral arteries at 1 cm upstream from their bifurcation, radial artery at the level of the wrist, anterior or posterior tibial artery at the level of the ankle. Careful direct measurement of the path lengths was used (rather than indirect estimation from height), as advised by Tanaka et al.9 Radiological work-up allowed avoiding measurements on arterial occlusion sites, which might introduce mistakes in length calculation. Dicom images were saved to a personal computer for subsequent off-line measurement (using MatLab® software, MathWorks, Natick, USA) of Carotid–Femoral, Carotid–Radial, Femoral–Ankle and Carotid–Ankle PWV values. The time delay between the peak of the ekg signal and the foot of the velocity wave was computed. The foot of the mean Doppler velocity waveform was manually identified on the Dicom image, using a mouse driven graphical interface on the personal computer. Analyses were performed independently by two experienced investigators using an interactive computer program; the results always differed by less than 5%.
Statistical analysis
All analysis were performed using NCSS Statistical Software® 2007 (Kaysville, USA). The non-parametric Kruskal–Wallis test was used to compare categorical results of PWV for Framingham and ABI scores. A p value less than 0.05 was considered significant.
Results
The main characteristics of the population are shown in Table 2.
| Total | Carotid or cardiac disease group | Symptomatic peripheral vascular group | |
|---|---|---|---|
| Number of patients | 62 | 31 | 31 |
| Mean age (years), range | 71.9 (48–89) | 71.4 (48–89) | 72.6 (55–87) |
| Male sex (%) | 72 | 79 | 64 |
| Coronary heart disease (%) | 24.2 | 32.4 | 16.0 |
| Diabetes mellitus (%) | 25.4 | 14.7 | 36.0 |
| Hypertension (%) | 79.1 | 82.3 | 76.0 |
| Systolic Blood pressure (mmHg) | 135 ± 18 | 132 ± 18 | 138 ± 17 |
| Diastolic Blood pressure (mmHg) | 77 ± 11 | 76 ± 11 | 78 ± 11 |
| Active smoker (%) | 31.8 | 23.5 | 40.0 |
| Dyslipidemia (%) | 57.9 | 55.9 | 60 |
| Total cholesterol (mg/dl) | 182 ± 59 | 177 ± 58 | 187 ± 59 |
| Mean Framingham scorea | 10.7 | 10.2 | 11.4 |
| Mean ankle–brachial index | 0.77 | 0.88 | 0.69 |
| Mean Carotid–Femoral PWV (m/s) | 13.28 ± 7.83 | 11.98 ± 6.16 | 15.05 ± 9.51 |
| Mean Femoral–Ankle PWV (m/s)b | 12.11 ± 5.45 | 10.88 ± 3.73 | 13.78 ± 6.91 |
Framingham-derived risk score adapted for intermittent claudication.12
Mean Femoral–Ankle PWV showed significant difference (p = 0.03) between the two groups.
Main characteristics of the patients included in the analysis (mean value and standard deviation).
We first classified the whole population on basis of the Framingham score. Figs. 1 and 2 show that Carotid–Femoral PWV significantly increased with the Framingham risk category (p < 0.0001). Carotid–Ankle PWV also increased significantly (p = 0.01) but to a lesser extent. There was no statistical significance for Femoral–Ankle (p = 0.8) and Carotid–Radial (p = 0.6) PWV.
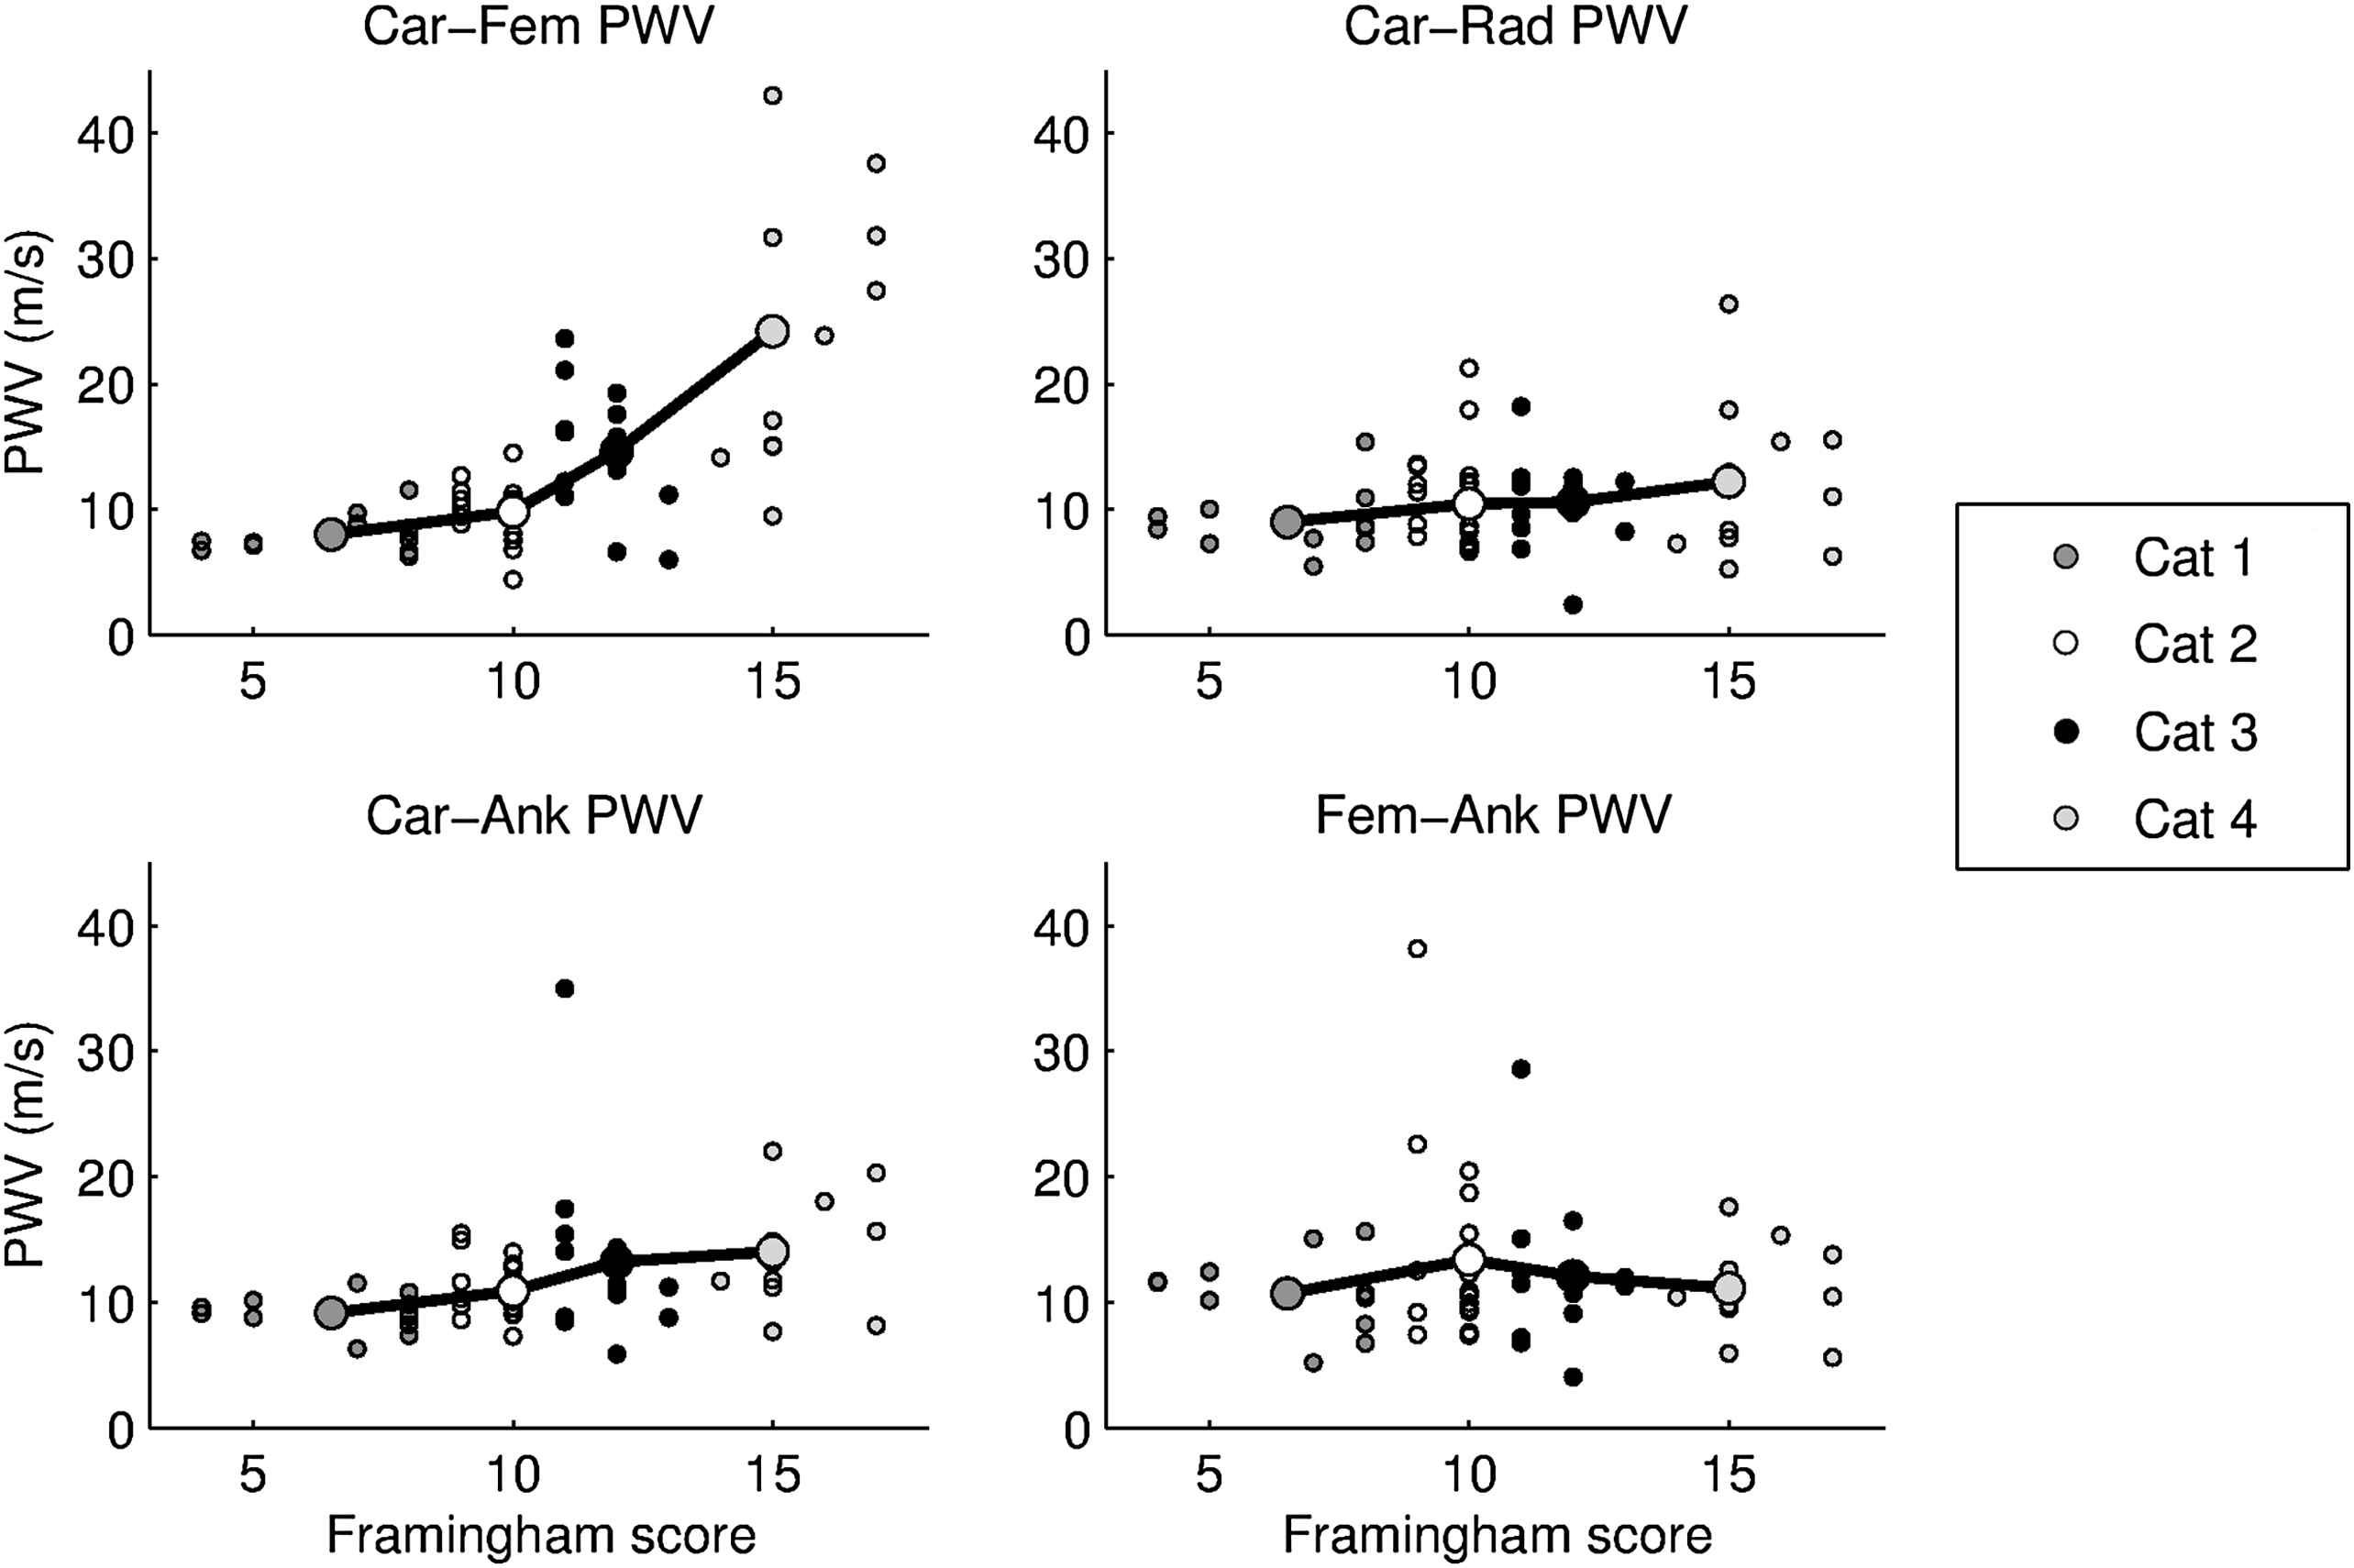
PWV values for each site of measurement (Carotid–Femoral, Carotid–Radial, Carotid–Ankle and Femoral–Ankle) for individual patients and mean value (bold circles) for the four categories according to Framingham risk score.
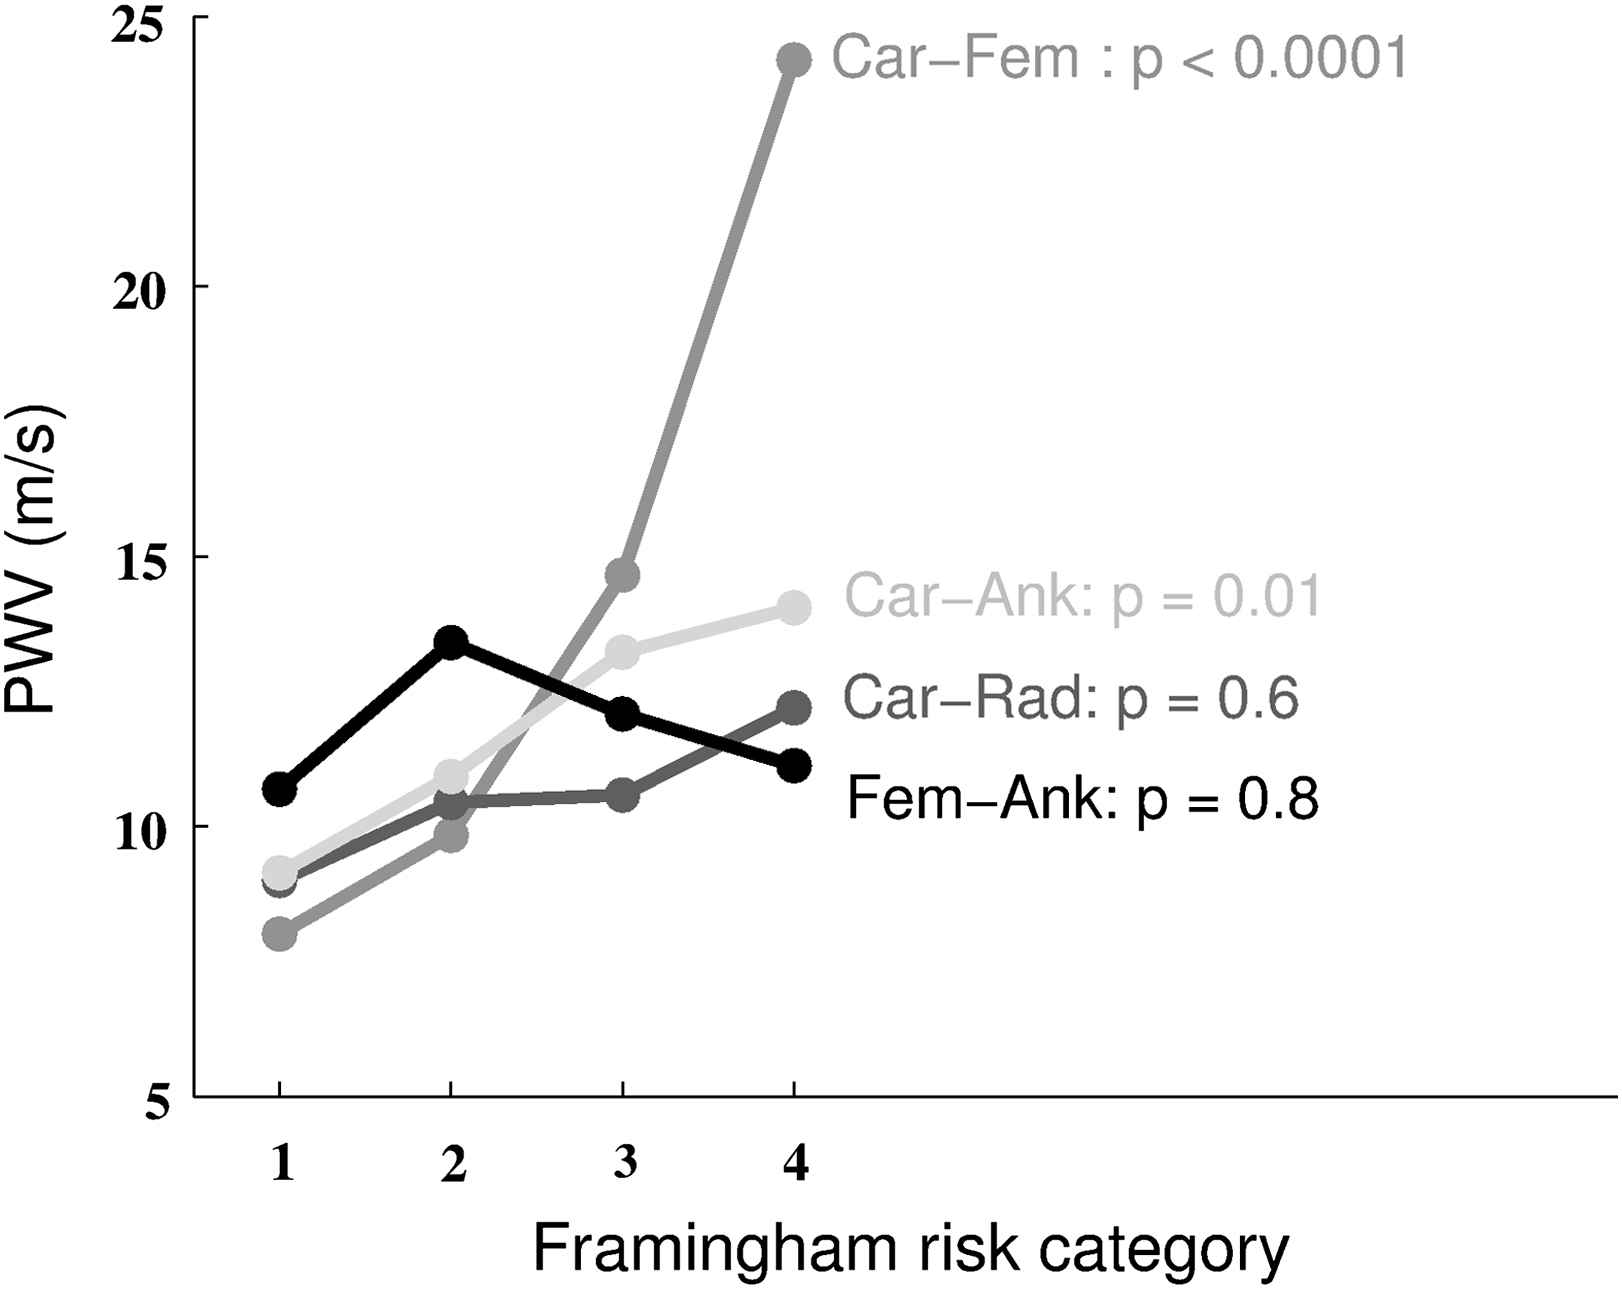
Mean PWV for each site of measurement and Framingham risk category. p values are shown for each site of measurement (Car-Fem: carotid–femoral; Car-Ank: carotid–ankle; Car-Rad: carotid–radial; Fem-Ank: femoral–ankle).
We then classified the whole population according to the ABI score. Figs. 3 and 4 show that the Carotid–Femoral PWV (p = 0.05), Femoral–Ankle PWV (p = 0.02) and Carotid–Ankle PWV (p < 0.001) significantly increased with the severity of the ABI index. There was no significant difference for Carotid–Radial PWV (p = 0.3).
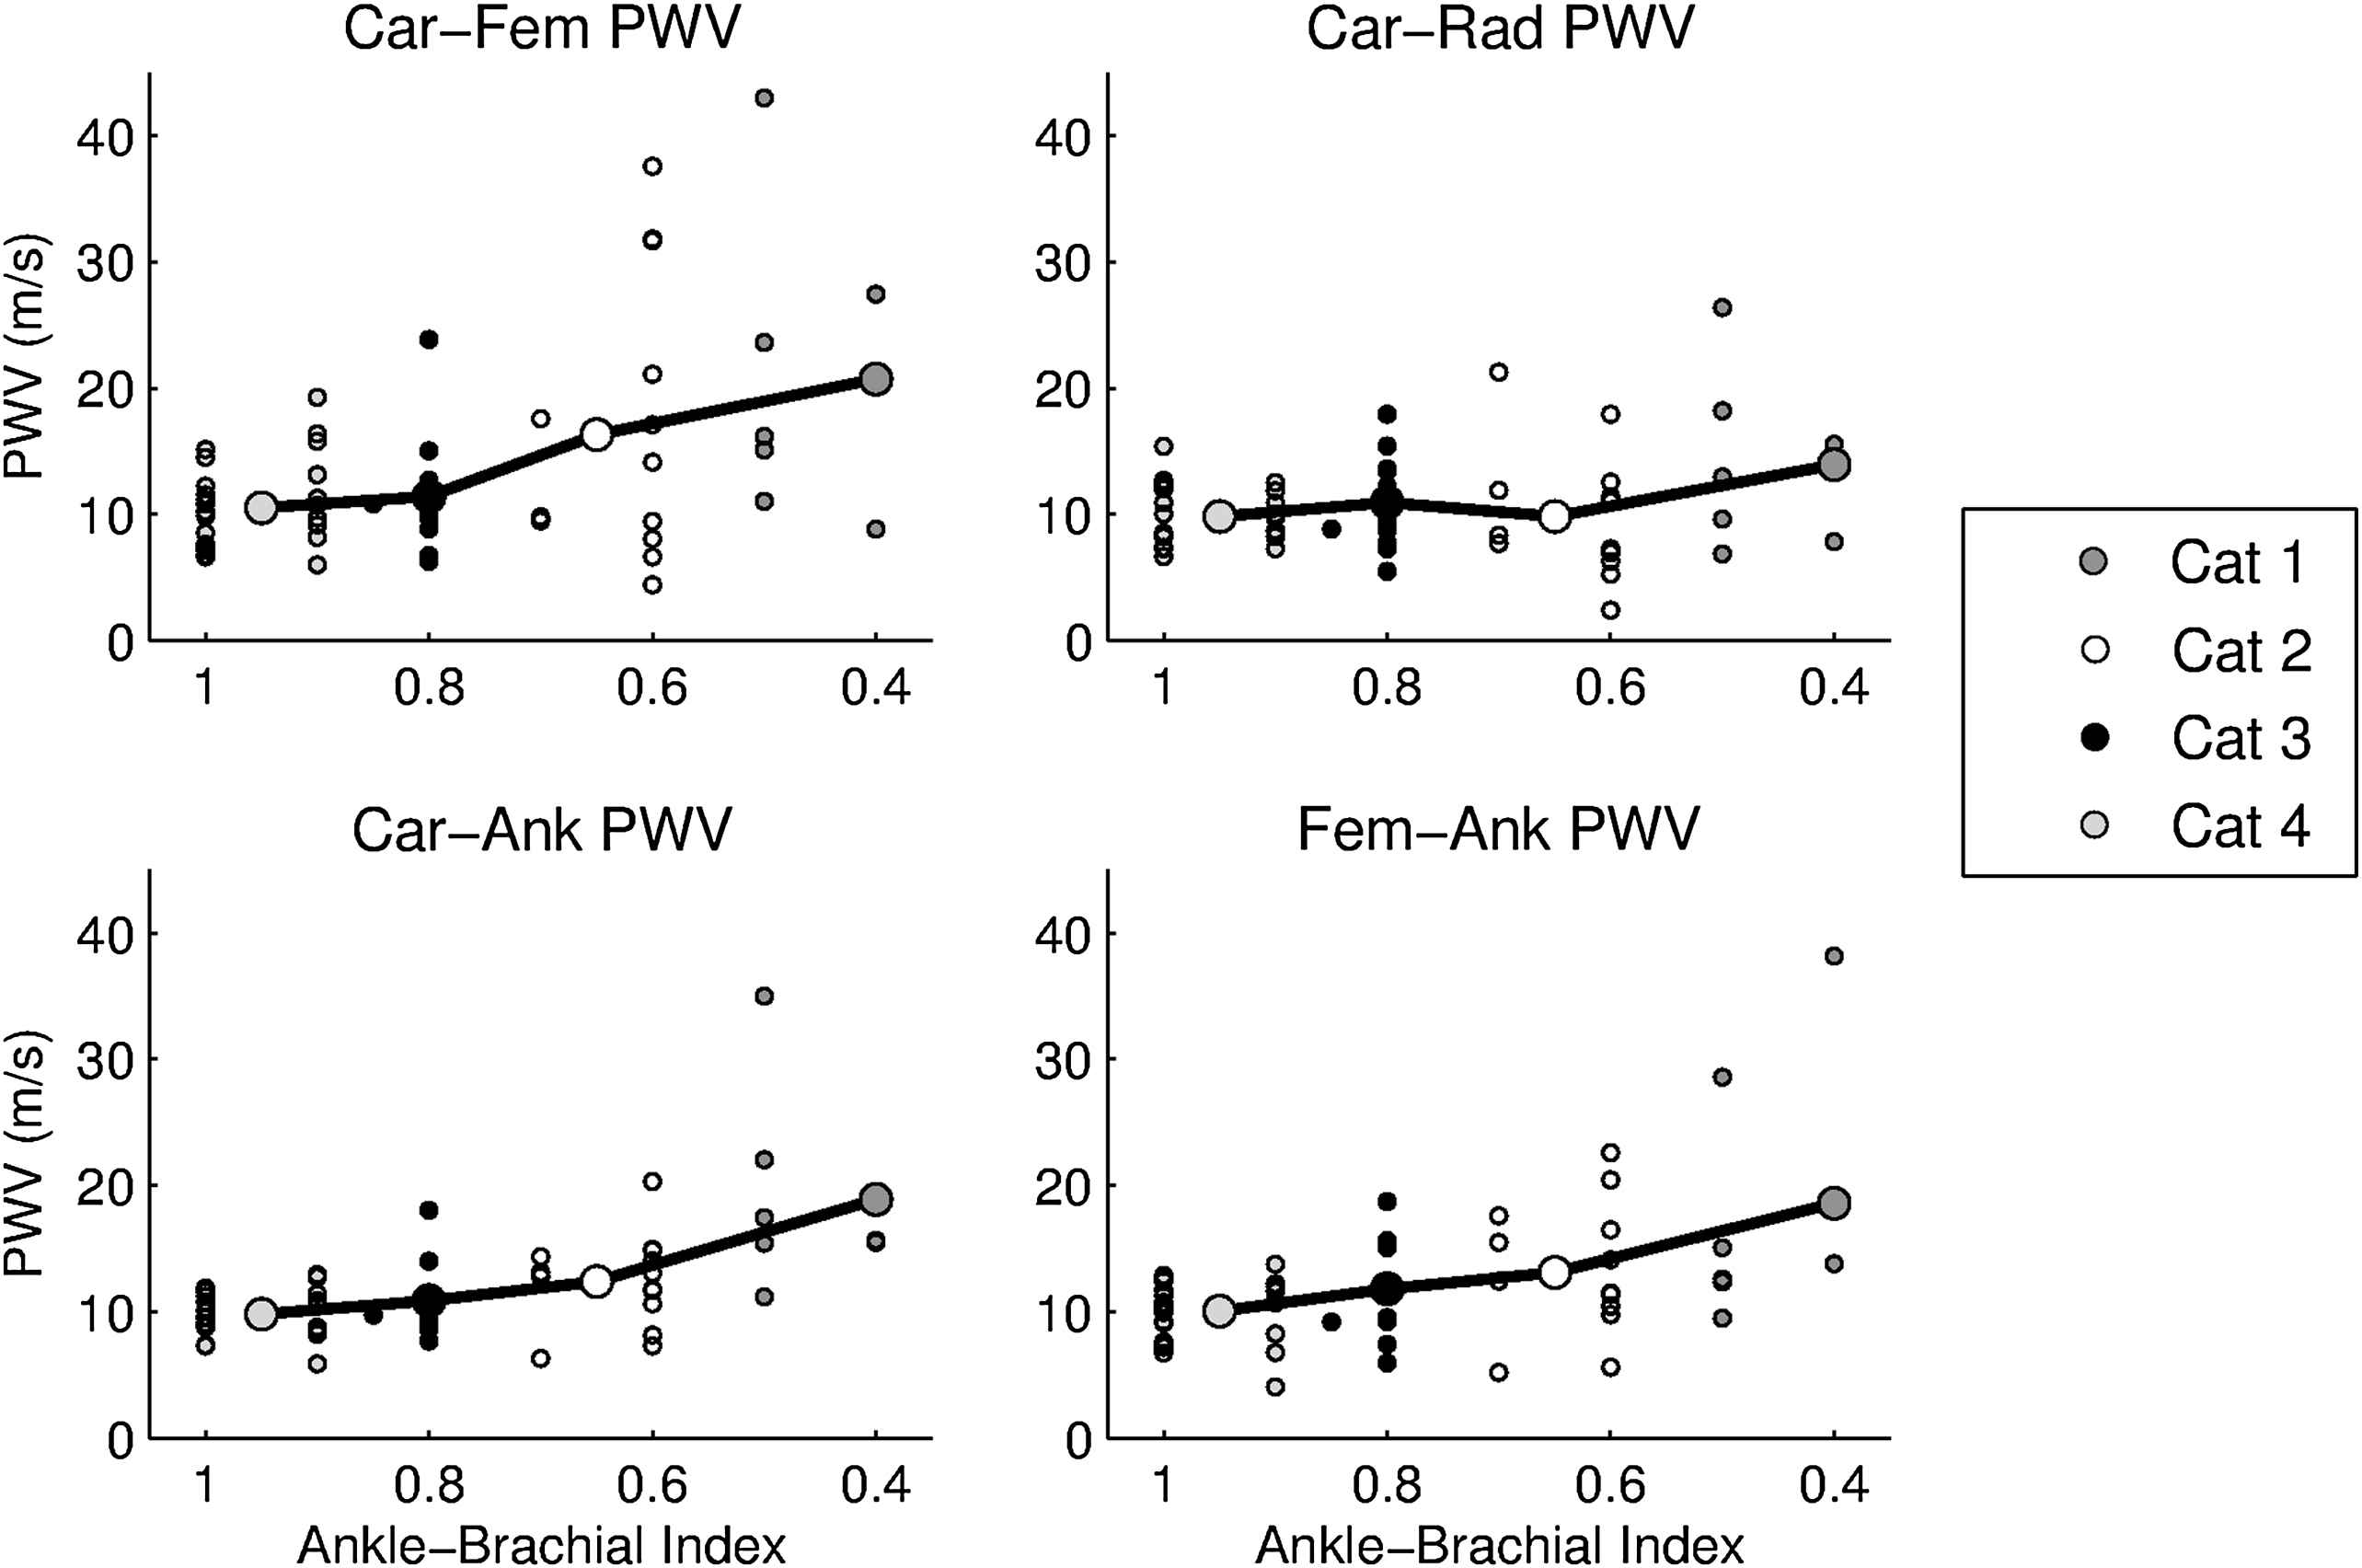
PWV values for each site of measurement (Carotid–Femoral, Carotid–Radial, Carotid-Ankle and Femoral–Ankle) for individual patients and mean value (bold circles) for the four categories according to the Ankle–Brachial index.
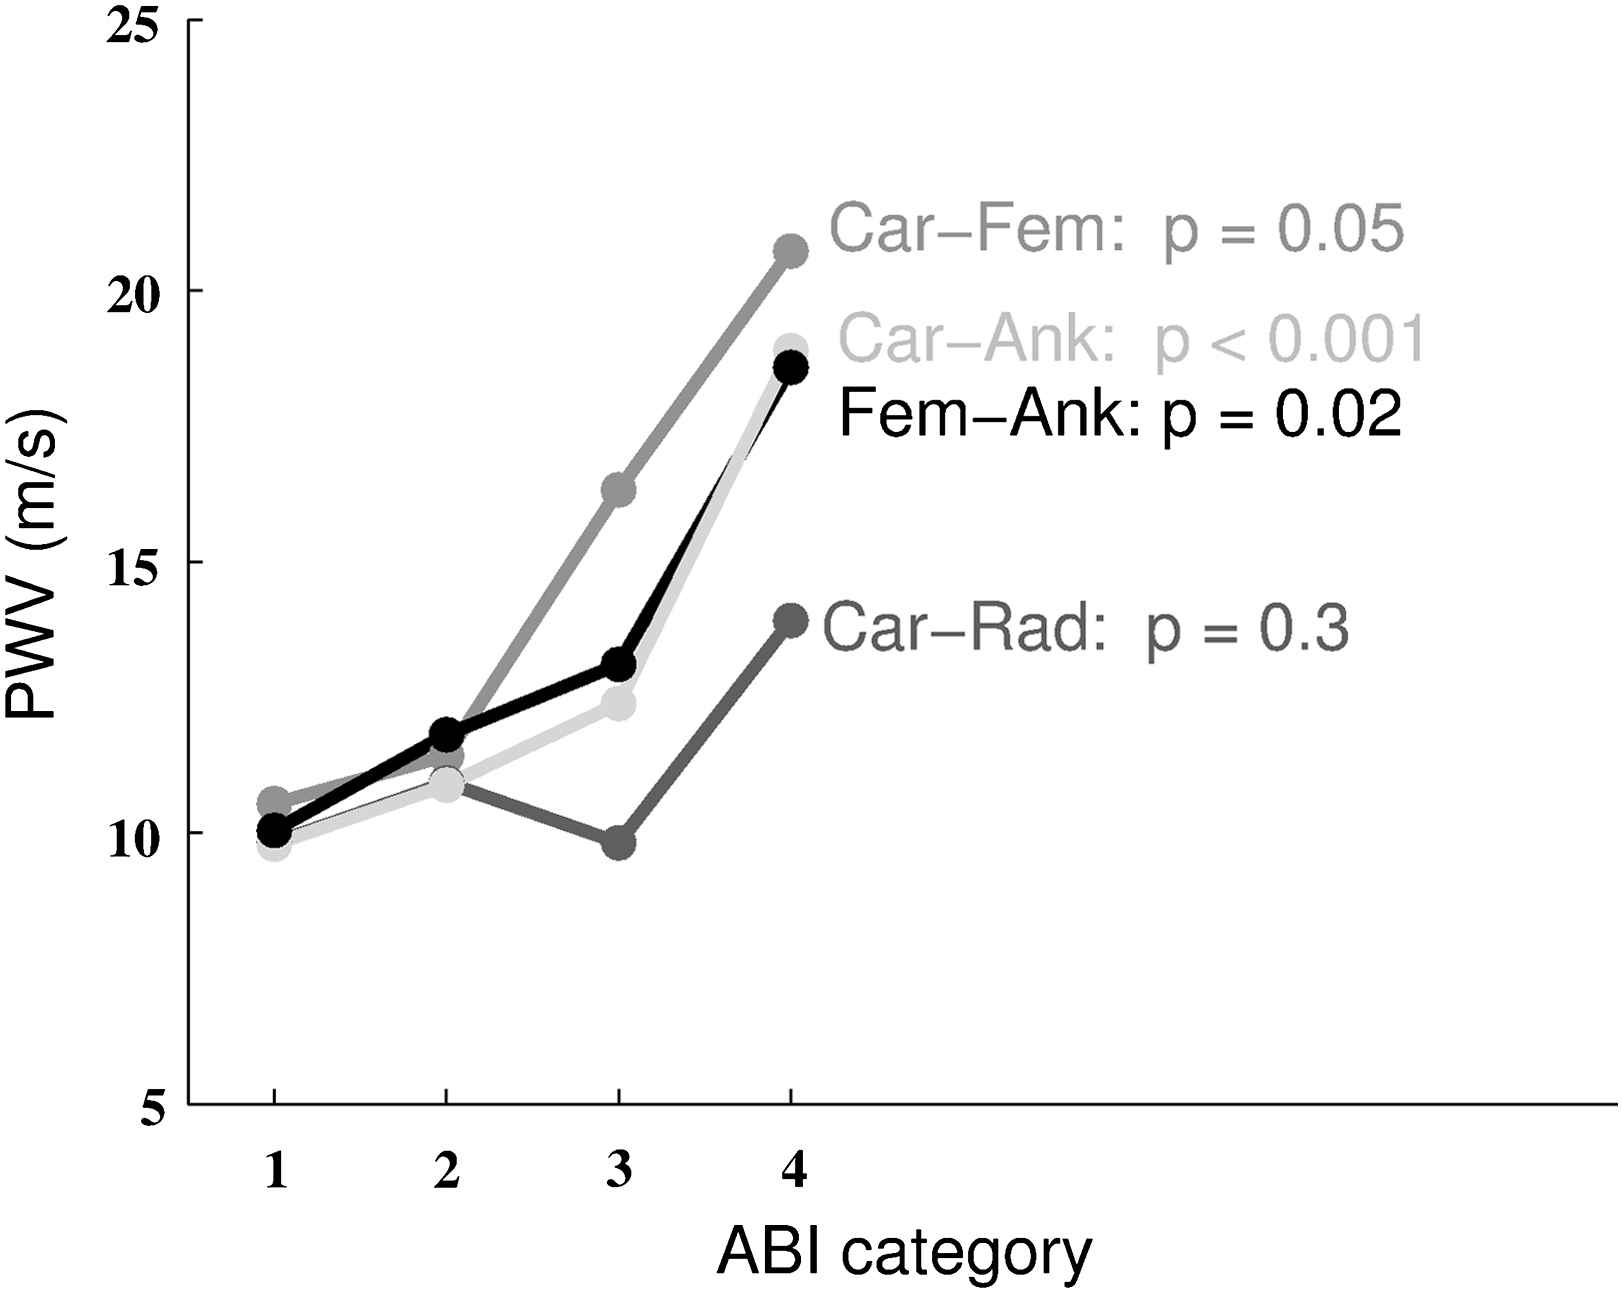
Mean PWV for each site of measurement and ABI risk category. p values are shown for each site of measurement (Car-Fem: carotid–femoral; Car-Ank: carotid–ankle; Car-Rad: carotid–radial; Fem-Ank: femoral–ankle).
Similar results were observed for the subgroup of patients admitted for symptomatic peripheral arterial disease (data not shown).
No significant correlation was identified between the Framingham scoring and the ABI values (linear correlation test, r = 0.4) when studying the whole population.
Discussion
This work was designed to study central and peripheral PWV in a population with various degree of severity for peripheral arterial disease with the purpose to adapt our analysis protocol to this particular population. Indeed, the usual applanation tonometry systems (SphygmoCor®, AtCor Medical, Sydney, Australia) or mechanotransducers (Complior®, Artech Medical, Paris, France) did not allow us to obtain valid results due to the weak and damped distal pressure waveforms, especially for the patients with a clinical peripheral arterial disease. This issue has already been pointed out by Motobe et al.,16 who have used the oscillometric method for pressure measurements in a cardiovascular diseased population. They postulated that the accuracy of the brachial–ankle PWV measure was decreased in the presence of an ABI < 0.95 due to the alterations of waveforms on stenotic or occlusive arterial disease. Therefore, we considered the “ekg-ultrasonographic” method for all patients and recorded velocity signals, as previously used by Tillin et al4 in a coronary-diseased population. Velocity signals are indeed more appropriate than pressure pulses as they easily allow analysis on deeper or calcified arterial vessels. In our study, we decided to identify manually the foot of the velocity waveform in order to avoid incorrect automatic detection. Indeed, automatic detection of the foot of the wave using algorithms described by Millasseau et al.11 proved to be inefficient when applied to velocity signals due to some shivering in the systolic increase. Moreover, radiological work-up in our population allowed ruling out occlusive disease, which had not been performed in the study by Motobe et al.16
Our population was first classified on a scale derived from the Framingham Heart Study,12 considering the main cardiovascular risk factors and adapted for peripheral arterial disease, in order to validate our results of central and peripheral PWV as a function of cardiovascular risk factors. We observed that Carotid–Femoral PWV was strongly associated with the scoring of cardiovascular risk factors, while Femoral–Ankle PWV was not. These results are in agreement with previous studies, describing the central measure as the gold standard marker of cardiovascular disease.2,4,6 Tsuchikura et al.7 also showed poor correlation between the Framingham risk score and Femoral–Ankle PWV. However, they studied patients without peripheral arterial disease, as patients with an ABI < 0.95 were excluded. When studying radiological parameters of atherosclerosis (presence of plaque and IMT) in coronary, carotid and femoral arteries, Tillin et al.4 also advised to use Carotid–Femoral PWV as the best indicator of cardiovascular disease rather than Femoral-Posterior tibial PWV (which failed to show statistical correlation with the severity of these radiological markers). This may be explained by the fact that, unlike central vessels such as the carotid artery, peripheral vessels like the femoral artery are much less affected by atheromatosis risk factors.8 Of note, in our study, Carotid–Ankle PWV was also slightly associated with the Framingham scoring, probably due to the Carotid–Femoral component of this measurement. In agreement with this hypothesis, Sugawara et al.5 showed (in healthy subjects) that aortic PWV explained more than a half of the total variance in Brachial–Ankle PWV. Furthermore, similarly to Tillin et al., our analysis confirmed that the Carotid–Radial PWV measurement should not be considered as representative of the general state of atherosclerosis.4
We then classified the population according to the Ankle–Brachial pressure Index, which represents the most reliable way to classify the population on basis of the severity of peripheral arterial disease. We observed a significant association of ABI with central, peripheral and Carotid–Ankle PWV. Based on these results, we suggest that central PWV remains the standard measure of arterial stiffness in the presence of peripheral arterial disease and that the peripheral stiffness becomes affected as the central, depending on the clinical severity of the peripheral arterial disease. We hypothesize that, if central and peripheral arteries show a different mechanical behaviour in low cardiovascular risk patients,8 peripheral arteries become similarly affected by arterial stiffening in the presence of a more severe disease. We found no significant difference of mean blood pressure between groups with low and high Carotid–Femoral PWV, indicating potential intrinsic arterial degeneration associated with the higher risk scores and higher degrees of peripheral vascular disease.
Finally, we did not find any statistical correlation between the Framingham and the ABI scores. This can be explained by the fact that a single cardiovascular risk factor, like diabetes, hypertension or smoking can contribute alone to a severe peripheral arteriopathy. Another argument to take into account is that the symptomatic vascular patients benefit from a better systemic treatment against their cardiovascular risk factors, thus underestimating their cardiovascular risk scoring compared to the peripheral clinical stage provided by the ABI.
In conclusion, we consider central PWV as the best indicator of cardiovascular disease, also adapted to monitor patients with peripheral vascular disease. Both central and peripheral PWV can be considered as specific indicators of the severity of peripheral vascular disease. If these findings are confirmed by prospective studies, central PWV could be considered as a grading test of the severity of peripheral arterial disease in clinical practice, as it is already the case for the ABI.
Funding
F.N.R.S. (Fonds National de la Recherche Scientifique) provided financial support to both authors (V.L and M.W) for the conduct of the research but had no role in the study design, analysis or reporting (convention 3.4.550.07.F).
References
Cite this article
TY  - JOUR
AU  - Valérie Lacroix
AU  - Marie Willemet
AU  - Robert Verhelst
AU  - Christophe Beauloye
AU  - Luc Jacquet
AU  - Parla Astarci
AU  - Alexandre Persu
AU  - Emilie Marchandise
PY  - 2011
DA  - 2011/09/09
TI  - Central and peripheral pulse wave velocities are associated with ankle–brachial pressure index
JO  - Artery Research
SP  - 28
EP  - 33
VL  - 6
IS  - 1
SN  - 1876-4401
UR  - https://doi.org/10.1016/j.artres.2011.08.003
DO  - 10.1016/j.artres.2011.08.003
ID  - Lacroix2011
ER  -