
Pulse pressure measured at the level of the femoral artery, but not at the level of the aorta, carotid and brachial arteries, is associated with the incidence of coronary heart disease events in a population with a high prevalence of type 2 diabetes and impaired glucose metabolism – The Hoorn study
- DOI
- 10.1016/j.artres.2014.12.003How to use a DOI?
- Keywords
- Central blood pressure; Femoral artery; Pulse pressure; Coronary heart disease; Cardiovascular disease; Type 2 diabetes mellitus
- Abstract
Introduction: Central (aortic or carotid) pulse pressure (PP) is more strongly associated with local organ damage and possibly mortality than brachial PP.
Aim: To investigate for the first time the association of femoral (f) PP with all-cause mortality, and incident cardiovascular disease (CVD), coronary heart disease (CHD) and cerebrovascular disease (CerVD) events, as well as with markers of renal function (estimated glomerular filtration rate, eGFR, and microalbuminuria).
Methods: We used data from a population-based study, by design including 50% type 2 diabetes and impaired glucose metabolism (IGM). The baseline examination included non-invasive PP assessment at the brachial, aorta (Sphygmocor device), carotid and femoral (ultrasound distention waves calibrated by brachial mean and diastolic pressure) arteries.
Results: After 7.8 years of follow-up (n = 449, age: 68.9 ± 6.0 males: 52%), 66 participants had died, 102 had a CVD event, 45 a CHD event, and 31 a CerVD event. PP at all sites was associated with incident all-cause mortality and CVD events. Only fPP was, however, associated with incident CHD events, even after adjustment for CVD risk factors (HRs 1.31 [1.07–1.61 95% CIs]). No association between PP and incident CerVD events was found – possibly due to the small number of events. fPP was associated with renal function but this was similar to other PP indices. No interaction between each any local PP index and glucose metabolism status or renal function was present.
Conclusion: Beyond anatomical topography, local fPP provide important information related to CVD events. This possibility and the underlying mechanisms should be further investigated.
- Copyright
- © 2014 Association for Research into Arterial Structure and Physiology. Published by Elsevier B.V. All rights reserved.
- Open Access
- This is an open access article distributed under the CC BY-NC license.
Introduction
Due to the phenomenon of pulse pressure (PP) amplification, brachial PP is an inaccurate marker of the actual pressure load imposed upon the heart.1 There is evidence that central PP (i.e., PP in the aorta or carotid artery) is more strongly associated with left ventricular dysfunction or, for instance, carotid intima-media thickness than brachial PP.2,3 Local PP may therefore be more strongly associated with local organ damage. A meta-analysis on the association between local PP and cardiovascular morbidity and mortality showed that central PP performed only marginally better than brachial PP when it came to the prediction of incident cardiovascular morbidity or mortality.4 Taking the above into account, the investigation of local PP along the arterial tree in relation to both local organ damage and morbidity and mortality is of particular interest.
The association of PP at the femoral artery (fPP) with the incidence of all-cause mortality and CVD events has never been investigated. The femoral artery is the closest, non-invasively accesible, arterial site to the renal arteries and thus the fPP might intergrate information about renal function, a well established determinant of CVD,5 that the aPP and cPP cannot. Moreover, the relative impact of type 2 diabetes and impaired glucose metabolism (IGM) on arterial stiffenning is greater in the femoral artery than the aorta and the carotid artery.6 Per se this has impact on local fPP. For these reasons fPP may have a strong potential to associate with incident all-cause mortality and CVD events, especially in individuals with type 2 diabetes and IGM.
In order to address these hypotheses, we analysed data from the Hoorn Study,6 a population-based study of elderly individuals by design including around 50% individuals with type 2 diabetes and IGM, which assessed local PP at 4 arterial sites (brachial, aortic, common carotid and common femoral). We investigated the association of, on the one hand, local PP indices at all 4 arterial sites, with on the other hand, all-cause mortality, incident CVD, coronary heart disease (CHD) events and cerebrovascular disease (CerVD) events. In addition, we investigated whether for each index of local PP the potential associations were independent of glucose metabolism status, mean blood pressure (MBP), and CVD risk factors, including renal function. Finally, we investigated (i) the association between each local PP index and renal function and (ii) the potential presence of interaction between each local PP estimate and glucose metabolism status or renal function and renal microcirculation with regard to the incidence of all outcomes.
Methods
Study design
For the present study, we used data from the 2000 Hoorn Study examination. The Hoorn study is a population-based cohort study of glucose metabolism and CVD risk among the inhabitants of the municipality of Hoorn in the Netherlands. The study started in 1989, and in 2000 a follow-up examination (n = 648) was done among surviving participants who gave permission to be re-contacted. Details of the study have been described elsewhere.7,8
Blood pressure assessment at the brachial, aortic, carotid and femoral artery
In all participants blood pressure (BP) was measured in a laboratory setting after at least 15 min of rest. PP was calculated as systolic BP-diastolic BP. The local PP indices are summarized in Table 1 and presented in further detail below. The brachial pulse pressure (bPP) was recorded in the left upper arm with an oscillometric device (Collin Press-Mate, BP-8800) 7 just before the recording of the radial pressure waveform with the SphygmoCor (AtCor Medical, Sydney, Australia) device and systolic and diastolic brachial BP was used as the calibration input in the system. The aPP was derived by the use of applanation tonometry and pulse wave analysis at the radial artery and the application of a generalized transfer function.7 The cPP and the fPP were assessed by implementing the Kelly-Fitchett method9 with the use of a wall track system ultrasound-derived distention waveforms, using a wall track system, as adopted by Van Bortel et al.10, as previously described in details.7 The MBP was calculated:(i) as “diastolic + PP/3” as well as, (ii) by the area under the curve method by the SphygmoCor device.
| Local PP indices | |
|---|---|
| bPP | Sphygmocor’s input brachial pressure that was recorded once just before the radial applanation tonometry |
| aPP | Aortic pulse pressure derived from the Sphygmocor devicea |
| cPP | Carotid pulse pressure, which corresponds to the calibratedb carotid distention waveform recorded during <1 min |
| fPP | Femoral pulse pressure, which corresponds to the calibratedb femoral distention waveform recorded during <1 min |
By application of the generalized transfer functions (SphygmoCor, AtCor Medical).7
Definition of the assessed local pulse pressure (PP) indices.
Other measurements
We assessed medical history, medication use, anthropometric (body height and weight) and biological (BP, total, high-density lipoproteins and low-density lipoproteins, total cholesterol, triglycerides, glucose and microalbuminuria (defined as albumin/creatinine ratio >2 mg/mmol)) variables as described elsewhere.7,8 Estimated glomerular filtration rate (eGFR) (mL/min/1.73 m2) was calculated according to the Chronic Kidney Disease Epidemiology Collaboration creatinine equation; creatinine was determined by a modified Jaffé assay.11 Smoking habits were categorized as current, former and non-smokers. Hypertension was defined as: systolic BP ≥ 140 mmHg and/or diastolic BP ≥ 90 mmHg and/or the use of anti-hypertensive medication. Prior CVD was defined as a history of myocardial infarction, transient ischaemic attack, or ischaemic stroke; self-reported angina pectoris or intermittent claudication; abnormalities on a resting electrocardiogram (Minnesota codes 1.1–1.3, 4.1–4.3, 5.1–5.3, or 7.1); a history of coronary bypass surgery or angioplasty, peripheral arterial bypass or nontraumatic amputation; and/or an ankle-brachial index of <0.9 in either leg. Physical activity, expressed as metabolic equivalent hours per week, was assessed by the Short Questionnaire to Assess Health-Enhancing Physical Activity.12
Follow-up
Follow-up on morbidity and mortality was complete until January 1, 2009. Information on morbidity was extracted from individuals’ medical records of their general practitioners and of the local hospital, and classified according to the 9th edition of the International Classification of Disease (ICD-9). We defined incident of new CVD events (non-fatal and fatal) as the ICD-9 codes 390–459 (“diseases of the circulatory system”) and 798 (“sudden death”). In addition, we specified incident of new CHD events as the occurrence of a non-fatal or fatal acute myocardial infarction (ICD-9 codes 410 and 411), other forms of acute or chronic ischaemic heart disease (413), a percutaneous transluminal coronary angioplasty or coronary artery bypass graft (ICD-9 clinical modification code 36), ventricular fibrillation (427.4–427.5) and sudden death (798). ICD-9 codes for incident CerVD events were 431–438. Data on the participants’ vital status were collected from the municipal population register of Hoorn. We determined for each participant whether or not death had occurred during follow-up, and if so, the date when death occurred. In addition, the cause of death was extracted from the medical records of the general practitioners and the hospital of Hoorn. Information on cause of death could not be obtained for 21 (22%) of the deceased participants.
Statistical analysis
All analyses were performed with the SPSS version 19.0 Chicago (IL), USA. Cox proportional hazard models were used to estimate the associations between, on the one hand, PP (aortic, carotid, femoral and brachial) indices, and, on the other, all-cause mortality as well as incident (fatal and non-fatal) CVD events, CHD events and CerVD events. The associations were analysed in the subpopulation of those individuals with available local PP estimates in all arterial sites (and available data on glucose metabolism status) in order to provide “comparable” results regarding the association of local PP with the outcomes (Fig. 1). Adjustment was performed for: age, sex, glucose metabolism status7 (model 1); additionally for MBP (model 2); and additionally for prior CVD, body mass index, triglycerides, total/HDL cholesterol, eGFR, microalbuminuria, physical activity, smoking habits and the use of anti-hypertensive and lipid-lowering medication (model 3). The association between local PP indices and eGFR and presence of microalbuminuria was assessed by linear and logistic regression analysis, respectively. Finally, interaction terms were used to explore whether any association of local PP estimates with the outcome differed according to glucose metabolism status, eGFR and microalbuminuria status. The associations, given as hazard ratios (HRs) or odds ratios (ORs) and corresponding 95% confidence intervals (CIs), were expressed per 10 mmHg increase of the PP indices. A p-value < 0.05 was considered statistically significant, except for the interaction analyses, where p-values < 0.10 were used.
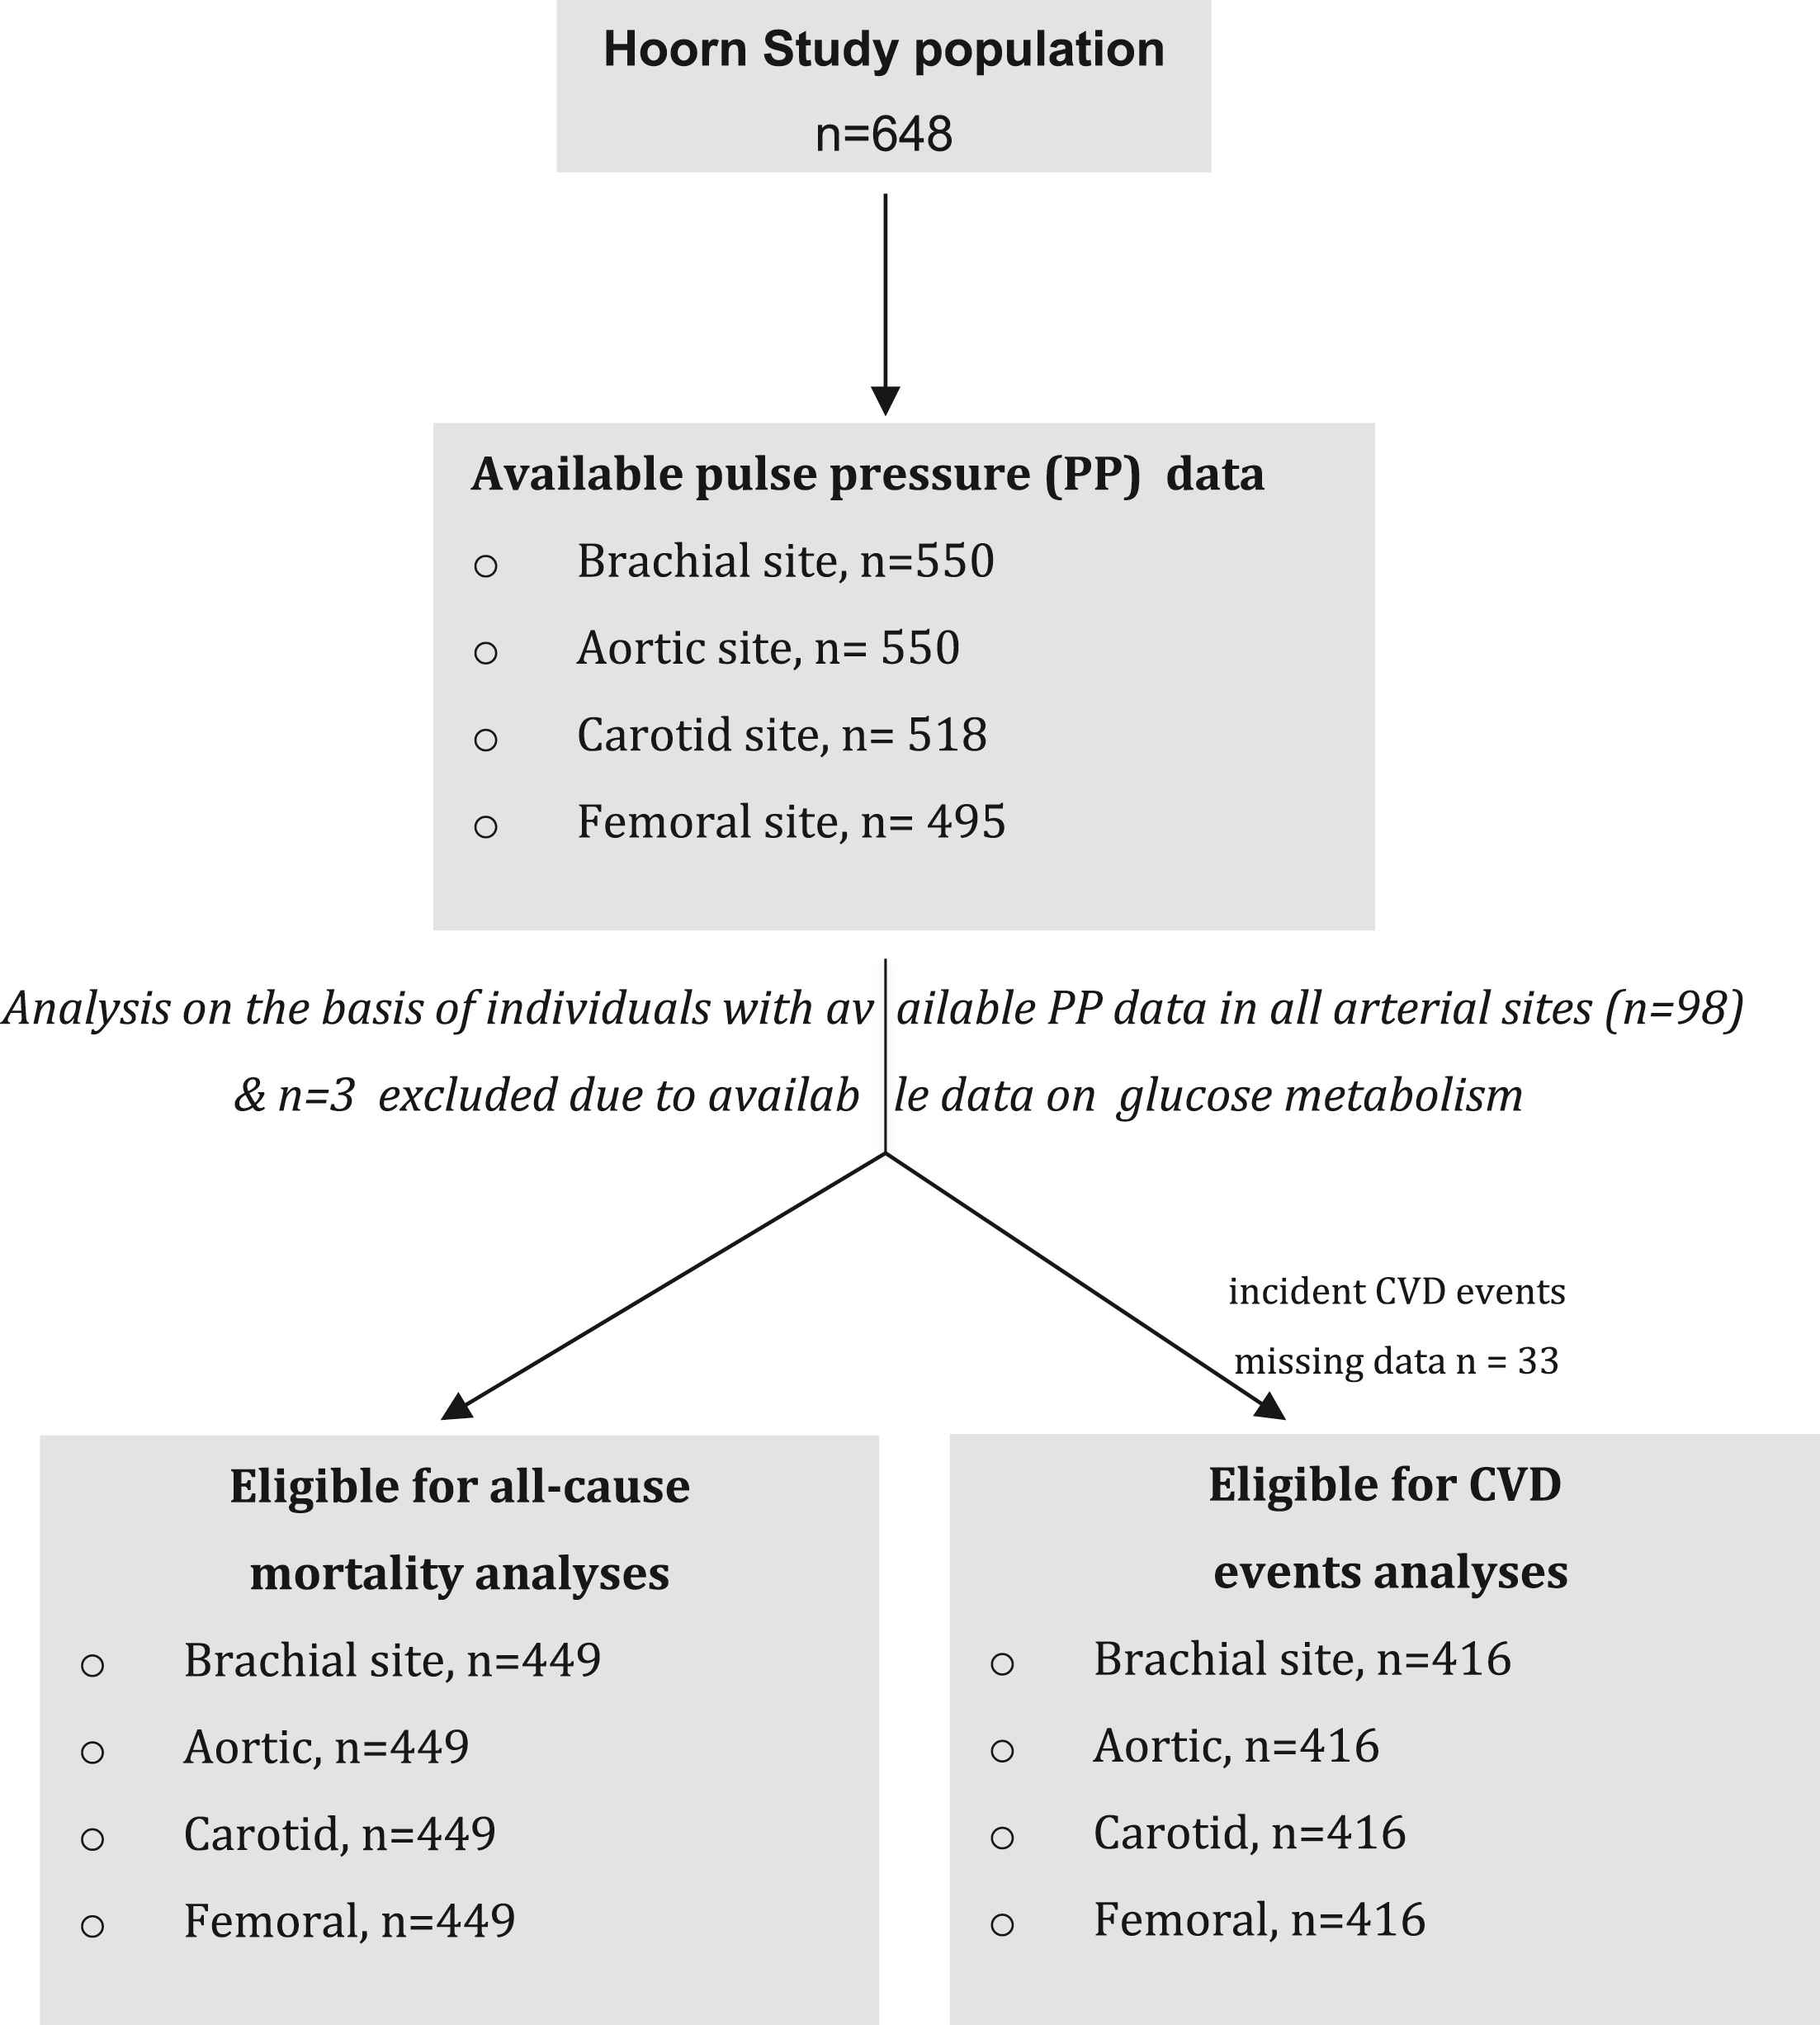
Criteria for the selection of the studied population.
Results
Study population
The studied population on the basis of individuals with PP data in all the studied arterial sites is shown in Fig. 1. The main reason for missing data on PP data was the poor quality of the definition of the arterial wall by ultrasound due to obesity and was observed most often in the femoral artery (in the herein studied population body mass index of those with PP data in the femoral artery as compared to those without was 26.4 ± 3.1 versus 30.2 ± 5.2 kg/m2 in the overall population). After excluding individuals with unavailable PP data in at least 1 arterial site (n = 99) and then excluding those individuals due to unavailable data on glucose metabolism (n = 3) the analysis was performed for all cause mortality (no missing data) and for CVD events (missing n = 33 either because the participants had moved out of the town of Hoorn or could not be contacted or because they gave no permission to access their medical files and/or to contact their general practitioner). Individuals without follow-up data did not differ from the study population (data not shown).
Clinical characteristics
Table 2 shows the baseline characteristics of the study population according to incident mortality and CVD status. This population is representative of the overall population of Hoorn Study (n = 648) (data not shown). After a median follow-up period of 7.8 years [interquartile range: 7.4; 8.2] 66 (14.7%) participants had died, 102 participants had had a CVD event, 45 had had a CHD event, and 31 had had a CerVD event.
| General characteristics | Survivors n = 383 (85.3%) | Deceased n = 66 (14.7%) | Participants without incident CVD event n = 314 (75.5%) | Participants with incident CVD event n = 102 (24.4%) |
|---|---|---|---|---|
| Women (%) | 49.6 | 37.9 | 52.2 | 33.3 |
| Age (years) | 68.4 ± 5.7 | 72.5 ± 6.6 | 68.4 ± 6.0 | 71.4 ± 5.9 |
| Smoking habits | ||||
| Current smoker (%) | 45.6 | 50.0 | 44.9 | 50.0 |
| Former smoker (%) | 14.5 | 19.7 | 12.1 | 22.5 |
| Non-smoker (%) | 39.9 | 30.3 | 43.0 | 27.5 |
| Physical activity (MET hours/week) | 84 (52–132) | 79 (46–160) | 82 (54–130) | 77 (48–125) |
| Prior cardiovascular disease (%) | 49.1 | 51.5 | 45.2 | 64.7 |
| Metabolic and renal parameters | ||||
| Glucose metabolism status | ||||
| Type 2 diabetes mellitus (%) | 17.5 | 33.3 | 19.1 | 21.6 |
| Impaired glucose metabolism (%) | 29.5 | 22.7 | 27.1 | 32.4 |
| Normal glucose metabolism (%) | 53.0 | 43.9 | 53.5 | 46.1 |
| Body mass index (kg/m2) | 26.4 ± 3.0 | 26.5 ± 3.0 | 26.4 ± 3.0 | 26.5 ± 3.0 |
| Hypertension (%) | 62.4 | 75.8 | 60.2 | 78.4 |
| HbA1c (%) | 5.8 ± 0.6 | 6.2 ± 0.8 | 5.9 ± 0.7 | 6.0 ± 0.7 |
| Total cholesterol (mmol/L) | 5.8 ± 1.0 | 5.7 ± 1.0 | 5.8 ± 1.0 | 5.8 ± 1.0 |
| LDL cholesterol (mmol/L) | 3.7 ± 0.9 | 3.7 ± 0.8 | 3.7 ± 0.9 | 3.7 ± 0.9 |
| HDL cholesterol (mmol/L) | 1.4 ± 0.4 | 1.4 ± 0.4 | 1.5 ± 0.4 | 1.4 ± 0.4 |
| Triglycerides (mmol/L) | 1.2 (0.9–1.7) | 1.4 (1.1–1.8) | 1.2 (0.9–1.7) | 1.4 (1.1–1.7) |
| Estimated glomerular filtration rate (ml/min/1.73 m2) | 62.9 ± 9.9 | 60.2 ± 11.4 | 62.9 ± 9.7 | 60.1 ± 11.2 |
| Microalbuminuria (albumin/creatinine ratio >2 mg/mmol) (%) | 10.7 | 25.8 | 10.5 | 19.6 |
| Medication use | ||||
| Lipid-lowering medication (%) | 12.8 | 15.2 | 11.1 | 21.6 |
| Anti-hypertensive medication (%) | 27.9 | 40.9 | 26.8 | 46.1 |
Data are presented as percentage, mean ± standard deviation or median (interquartile range).
Abbreviations: MET: metabolic equivalent of task, LDL: low density lipoprotein, HDL: high density lipoprotein.
Clinical characteristics of the study population at baseline according to all-cause mortality status and incident cardiovascular disease (CVD).
Local PP at different arterial sites
Figure 2 shows MBP as assessed by both methods and PP derived at each site of the arterial tree during the laboratory assessment.
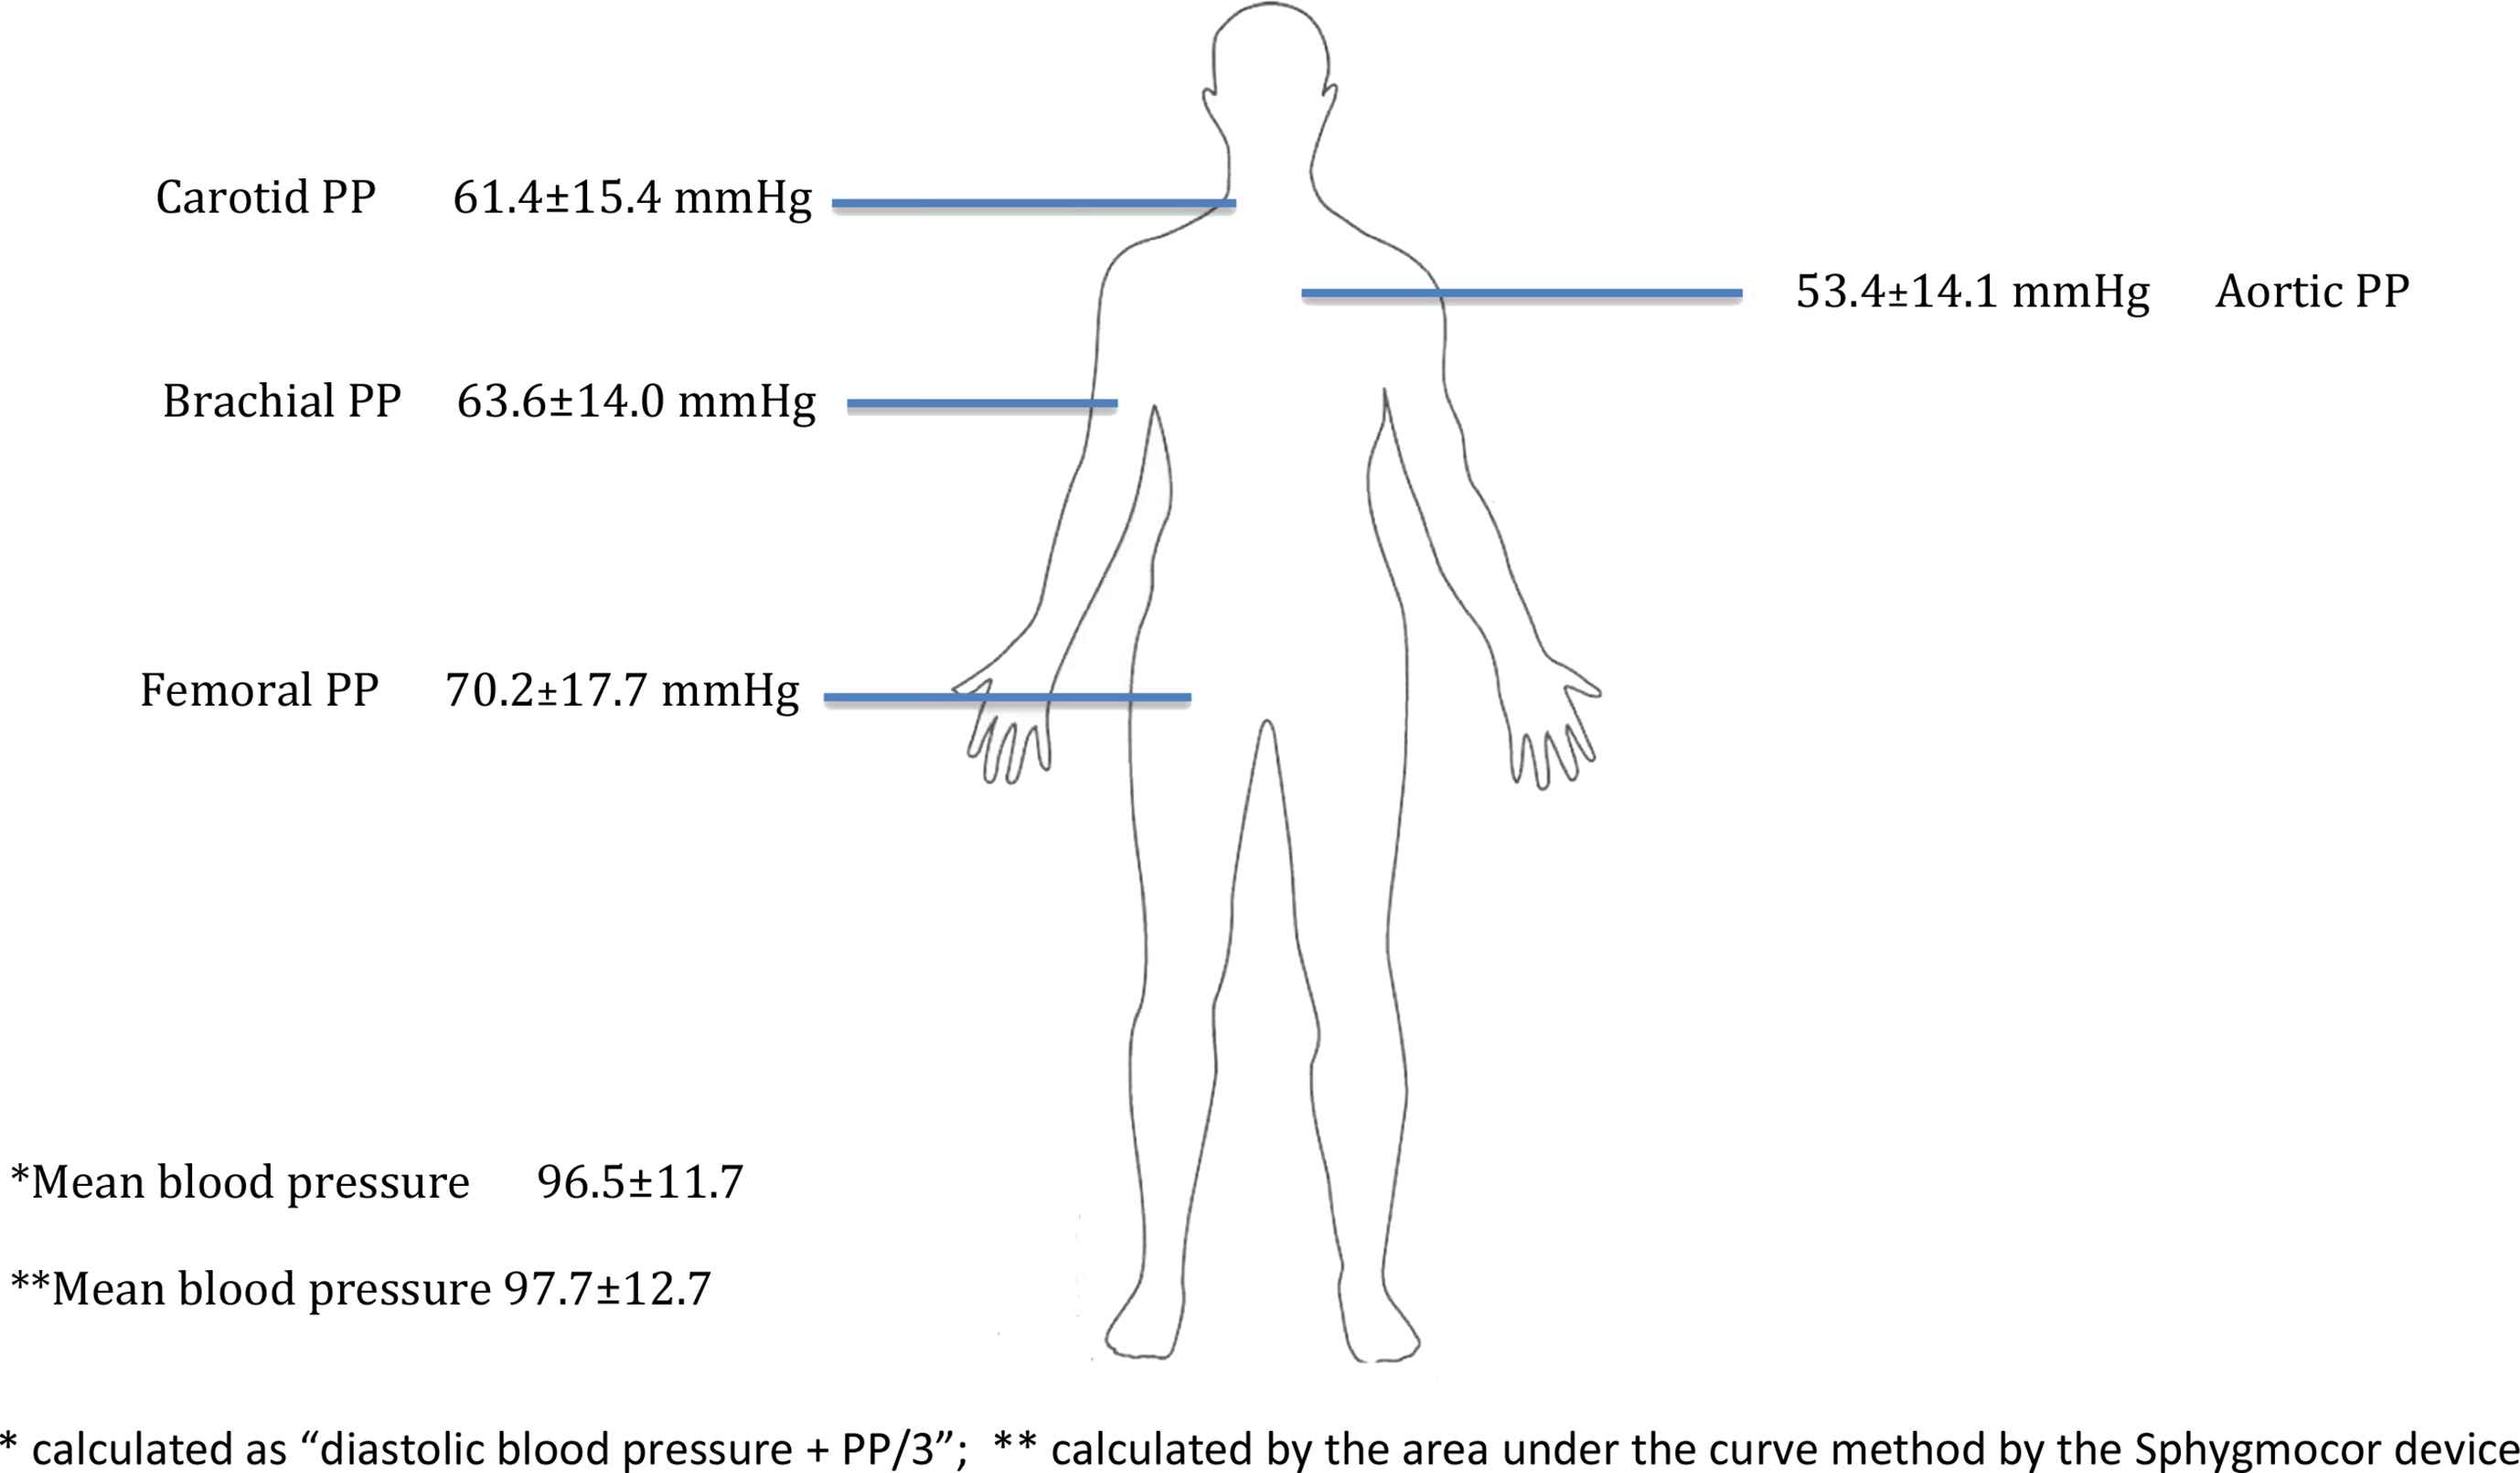
Values (mean ± standard deviation) of mean blood and local pulse pressure pressure derived at each site.
Survival analysis of the population
All-cause mortality: PP at all arterial sites was significantly associated with incident all-cause mortality. After adjustment for model 1 only fPP was associated with incident all-cause mortality with HRs (95% CIs) for 10 mmHg of higher PP 1.14 (1.01–1.29) (Table 3).
| Arterial site: | brachial PP | aortic PP | carotid PP | femoral PP |
|---|---|---|---|---|
| All cause mortality | ||||
| Number of deaths: 66 | ||||
| Unadjusted model | 1.31 (1.13–1.52) | 1.27 (1.09–1.48) | 1.18 (1.05–1.32) | 1.18 (1.07–1.30) |
| Model 1 | 1.17 (0.98–1.39) | 1.15 (0.96–1.37) | 1.11 (0.95–1.31) | 1.14 (1.01–1.29) |
| Model 2 | 1.10 (0.87–1.38) | 1.07 (0.85–1.34) | 1.05 (0.86–1.28) | 1.10 (0.95–1.28) |
| Model 3 | 1.06 (0.83–1.35) | 1.02 (0.81–1.30) | 1.02 (0.82–1.25) | 1.08 (0.93–1.26) |
| Cardiovascular disease events | ||||
| Number of events: 102 | ||||
| Unadjusted model | 1.17 (1.03–1.32) | 1.15 (1.02–1.39) | 1.15 (1.02–1.30) | 1.15 (1.04–1.28) |
| Model 1 | 1.11 (0.96–1.28) | 1.13 (0.97–1.31) | 1.13 (0.97–1.32) | 1.16 (1.02–1.31) |
| Model 2 | 1.13 (0.93–1.36) | 1.15 (0.95–1.38) | 1.15 (0.96–1.38) | 1.17 (1.02–1.36) |
| Model 3 | 1.11 (0.91–1.35) | 1.12 (0.92–1.34) | 1.01 (0.90–1.33) | 1.11 (0.99–1.31) |
| Coronary heart disease events | ||||
| Number of events: 45 | ||||
| Unadjusted model | 1.21 (1.00–1.45) | 1.20 (0.99–1.45) | 1.14 (0.95–1.37) | 1.21 (1.05–1.40) |
| Model 1 | 1.14 (0.91–1.43) | 1.18 (0.94–1.47) | 1.10 (0.80–1.37) | 1.25 (1.07–1.48) |
| Model 2 | 1.31 (0.98–1.74) | 1.34 (1.00–1.79) | 1.16 (0.91–1.50) | 1.36 (1.01–1.65) |
| Model 3 | 1.28 (0.95–1.72) | 1.35 (1.00–1.82) | 1.15 (0.84–1.51) | 1.35 (1.11–1.66) |
Model 1: age, sex, glucose metabolism status; model 2: model 1 & mean blood pressure, model 3: model 2 & plus prior cardiovascular disease, BMI, triglycerides, total/HDL cholesterol ratio, eGFR, microalbuminuria, physical activity, smoking habits and use of lipid-lowering and anti-hypertensive medication.
Hazard ratios (95% confidence intervals) (presented in bold when p<0.05) between local pulse pressure (PP) and outcomes.
CVD events: PP at all arterial sites was significantly associated with incident CVD events. Only fPP remained significantly associated with CVD events after adjustment for model 2 with HRs (95% CIs) for 10 mmHg of higher PP 1.17 (1.02–1.36) (Table 3).
CHD events: Only fPP was significantly associated with incident CHD events even after adjustment for model 3 with HRs (95% CIs) for 10 mmHg of higher PP 1.35 (1.11–1.66) (Table 3).
Association of local PP indices with renal function
PP at all the arterial sites was inversely associated with eGFR and positively with the presence of microalbuminuria (Table 4). fPP had the second highest correlation coefficient with eGFR but the lower ORs for presence of microalbuminuria as compared to other PP indices.
| eGFR | Microalbuminuria | |
|---|---|---|
| brachial PP | −0.203* | 1.48 (1.23–1.79) |
| aortic PP | −0.209* | 1.44 (1.20–1.74) |
| carotid PP | −0.250* | 1.22 (1.04–1.43) |
| femoral PP | −0.234* | 1.22 (1.07–1.34) |
p < 0.001.
Associations between local pulse pressure (PP) and estimated glomerular filtration (eGFR) rate (Spearman linear correlation coefficient) and presence of microalbuminuria [odds ratios (95% confidence intervals)] (presented in bold when p<0.05).
Interaction analysis
No significant interaction (p-values > 10) was present between local PP estimates at each arterial site and glucose metabolism status as well as renal function (eGFR or the presence of microalbuminuria) with regard to any evaluated outcome was observed (data not shown). Further additional analysis showed no interaction between sex and local PP with regard to any evaluated outcome (data not shown).
Discussion
In this study PP in all studied arterial sites (brachial, aortic, carotid and femoral) was associated with all-cause mortality and incident CVD events. However, only PP at the femoral artery was associated with incident CHD events. This association was independent of CVD risk factors, including type 2 diabetes, IGM and renal function, and was not significantly modified in the presence of these two factors (renal function and diabetes/IGM). fPP did not associate better than PP in other arterial sites with renal function, as assessed by eGFR and microalbuminuria.
The main strength of this study is that local PP was assessed non-invasively at 4 different arterial sites, including the femoral artery for the first time. A previous invasive study assessed PP at multiple sites but did not report the association of PP at each site with mortality or CVD events.13,14 We also performed a separate outcome analysis for CHD and CerVD events. So far all previous studies have used composite CVD end points14–18 whereas one study19 investigated the incidence or coronary restenosis after angioplasty. Finally, the design of the study (50% of the population had type 2 diabetes or IGM) allowed us to test the interaction effect of the glucose metabolism status on the association of local PP with the incidence of mortality and CVD events.
The evidence presented implies that PP at the femoral may be a better predictor of CHD events than PP in other arterial sites, including PP at the ascending aorta. We cannot exclude the possibility that this result might be related to the play of chance. However, this is unlikely because the association remained strong and statistically significant even after multiple adjustments for all the determinants of CHD. Because the fPP is not a good surrogate marker of the left ventricular afterload (the average aortic to femoral PP amplification was 16 mmHg) the explanation of the principal finding of this study is not obvious.
Our principal hypothesis was that local fPP due to its relative proximity to the renal artery might integrate information related to renal function, a well-known CVD risk factor,5 which is not provided by aPP, cPP or bPP. Several studies have shown a strong association between the pulsatile component of the brachial BP wave and renal function/microcirculation.20,21 In a recent invasive study the PP at the abdominal aorta13,14 – assessed at the level of the renal arteries - was more strongly associated with kidney function than PP at the ascending aorta. In the present study, although fPP had a higher correlation coefficient with eGFR than aPP, the overall data do not fully support our principal hypothesis. This may be due to mis-estimation of the PP amplification between the abdominal aorta to the femoral artery by the non-invasive methodology applied herein or may simple represent the actual ability of fPP to associate with eGFR and microalbuminuria. The validity of this hypothesis should be further investigated in invasive and non-invasive prospective studies.
A possible explanation of the present findings might be related to the specific intrinsic wall properties of the femoral artery. Extensive differences exist from arterial site to site regarding the development of arteriosclerosis and atheromatosis. These differences are driven by intrinsic wall properties and by their interaction with local haemodynamic (pressure/flow) patterns that may prime different gene expression profiles leading to different cells reactions to the same CVD risk factor.22 Accumulating evidence suggests that, compared to the other arteries (brachial, common carotid and ascending aorta) studied herein the femoral artery has an atherogenicity profile23,24 and arterial wall elastic properties25,26 that are closest to those of the coronary arterial bed. Moreover, the relative stiffening impact of type 2 diabetes and IGM on the femoral artery is higher than on the carotid or the aorta.6 Therefore, femoral stiffness seems to associate better with the incidence of CVD events than carotid or aortic stiffness.27 Since the local fPP is per se determined by the local femoral properties, it might well integrate these discriminatory abilities.
The two most widely applied methods for the assessment of central PP (aPP by the Sphygmocor’s device and cPP by the Kelly-Fitchett method) were used in the present study.28 This allows for the first time their “comparison” in terms of association with the incidence of all-cause mortality and CVD events. The two methods had similar associations with all the outcomes. However, as expected,1,29,30 they provided diverging absolute estimates of the local central PP values (aortic to carotid PP amplification 7–8 mmHg) and cannot be used interchangeably in clinical research. Moreover, both methods had similar HRs to those provided by bPP. Indeed, the evidence is conflicting whether in the elderly (>65 years of age) central PP associated more strongly than bPP with incident mortality and CVD events17–19; however the actual benefit from the assessment of central PP in the elderly may be small due to the relatively small PP amplification.1,29,30 Further research is required to identify populations that will benefit from central PP assessment.31
We did not observe any association between local PP and CerVD. This might be explained by the small number of CerVD events, which is further subdivided into different pathologies, resulting in small power to detect this association.
We acknowledge the presence of limitations in this study. The results should be carefully extrapolated to different age groups because the PP amplification gradient changes with age.1 Moreover, the results may not be applicable for higher BMI groups (>30 kg/m2) since the latter was the main factor that restricted the assessment of femoral PP in a small subpopulation (around 10%). We also acknowledge the fact that the results presented here depended on the methods, devices and settings that were used (particularly regarding the ability of ultrasound methodology to assess femoral pressure waveform) and may differ from cohort to cohort.28,29 Invasive studies are needed in order to draw better conclusions about the potential value of local PP specificity for the assessment of organ-specific events.
The recent 2013 European guidelines for the management of arterial hypertension suggest that the clinical use of central PP might be beneficial in young individuals with isolated systolic hypertension.31 The present results in an elderly population with 50% prevalence of type 2 diabetes and IGM suggest that beyond the anatomical topography, local PP at other sites beyond the central arteries, like the femoral artery, might provide important information for the prediction of CHD events. This possibility as well as the underlying reasons should be further investigated.
Funding sources
Athanase D. Protogerou has received funding from the European Union Seventh Framework Programme ([FP7/2009-2013]) under grand agreement No. 299086. Throughout the years, The Hoorn Study was supported by research grants from The Netherlands Organization for Health Research and Development, The Netherlands Heart Foundation (grant No. 98154), and the Dutch Diabetes Research Foundation.
Disclosures
None.
Conflict of interest
None.
Abbreviations
- aPP
aortic pulse pressure
- BP
blood pressure
- bPP
brachial pulse pressure
- cPP
carotid pulse pressure
- CerVD
cerebrovascular disease
- CHD
coronary heart disease
- CIs
confidence intervals
- CVD
cardiovascular disease
- eGFR
estimated glomerular filtration rate
- fPP
femoral pulse pressure
- HR
hazard ratio
- ICD-9
international classification of disease, 9th edition
- IGM
impaired glucose metabolism
- MBP
mean blood pressure
- OR
odds ratio
- PP
pulse pressure
References
Cite this article
TY  - JOUR
AU  - A.D. Protogerou
AU  - T.T. van Sloten
AU  - R.M.A. Henry
AU  - J.M. Dekker
AU  - Giel Nijpels
AU  - C.D.A. Stehouwer
PY  - 2015
DA  - 2015/01/09
TI  - Pulse pressure measured at the level of the femoral artery, but not at the level of the aorta, carotid and brachial arteries, is associated with the incidence of coronary heart disease events in a population with a high prevalence of type 2 diabetes and impaired glucose metabolism – The Hoorn study
JO  - Artery Research
SP  - 19
EP  - 26
VL  - 9
IS  - C
SN  - 1876-4401
UR  - https://doi.org/10.1016/j.artres.2014.12.003
DO  - 10.1016/j.artres.2014.12.003
ID  - Protogerou2015
ER  -