
Home Blood Pressure Assessment in Children with Autism Spectrum Disorder: A Feasibility Study
- DOI
- 10.2991/artres.k.191123.001How to use a DOI?
- Keywords
- Blood pressure; children; autism spectrum disorder; reliability
- Abstract
Introduction: Measurement of Blood Pressure (BP) in children provides insight into future Cardiovascular Disease (CVD) risk.
Objective: To examine the feasibility and reliability of home BP monitoring in children with Autism Spectrum Disorder (ASD) and compare to office BP measurement.
Methods: Seven day home BP monitoring was completed using an electronic device in 16 children with ASD (mean age 7 ± 3, n = 2 girls) and compared with a single “office” BP measure. Parents were asked to take two measures in the morning and two measures in the early evening.
Results: Eleven parents were able to obtain >75% of measures with eight of those 11 parents obtaining >90% of measures. There were no statistical differences between mean office Systolic BP (SBP) and mean home SBP (mean difference 2 ± 9 mmHg, p = 0.46) or mean office Diastolic BP (DBP) and mean home DBP (mean difference 1 ± 7 mmHg, p = 0.68). The correlation between home and office SBP was r = 0.44 (p = 0.02). The correlation between home and office DBP was r = 0.43 (p = 0.05). Home SBP correlated with age, height and BMI (p < 0.05) while office SBP did not (p > 0.05). Three days with 4 measurements/day was sufficient to achieve reliable home BP measurements (G > 0.8).
Conclusion: Home BP monitoring is feasible in children with ASD, is associated with typical correlates (age, height), and is better associated with obesity status (BMI) than office BP measurement.
- Copyright
- © 2019 Association for Research into Arterial Structure and Physiology. Publishing services by Atlantis Press International B.V.
- Open Access
- This is an open access article distributed under the CC BY-NC 4.0 license (http://creativecommons.org/licenses/by-nc/4.0/).
1. INTRODUCTION
Examining Blood Pressure (BP) in childhood offers a window into Cardiovascular Disease (CVD) risk [1] and high BP in childhood is associated with the future development of hypertension [2]. Thus, accurate assessment of BP in children will be critical for the primordial prevention and management of BP-related CVD [3].
Autism Spectrum Disorder (ASD) is one of the most common developmental disabilities in the United States, being diagnosed in approximately one in every 68 births [4]. As the number of children diagnosed with ASD continues to rise, so too will the eventual number of adults with ASD. This is important to note as the prevalence of hypertension is higher in adults with ASD compared to adults without ASD [5–7] and CVD is a leading cause of mortality among adults with ASD [8,9]. The measurement of BP in children with (ASD) can be challenging. In our previous work, we were able to successfully measure BP in 19 of 30 children with ASD [10]. Sensory differences and sensitivity to the sensation of arm compression/texture of the BP cuff resulted in some children with ASD having an aversion to the BP measurement process. Given links between childhood BP and adult onset hypertension and CVD, strategies are needed to improve the efficacy of BP measurement in children with ASD.
Home BP is emerging as a useful tool when assessing CVD risk in children [11]. Similar to results seen in adults, home BP more closely associates with target organ damage in children [12]. Home BP more closely associates with CVD risk factors in children such as the presence of obesity [13]. Childhood obesity increases risk for CVD and premature cardiovascular mortality in adulthood [14,15] and the prevalence of obesity is higher in children with ASD compared to typically developing children [16–18].
The purposes of this study were as follows: (1) to explore the feasibility and reliability of home BP monitoring in children with ASD; (2) to compare home and “office” BP in children with ASD; (3) to examine typical correlates of home and “office” BP (age, stature and obesity status) in children with ASD.
2. MATERIALS AND METHODS
Eighteen children (two girls) with ASD between 4 and 12 years of age participated in this study. Inclusion criteria included a parent report of an ASD diagnosis by a psychologist or school personnel. This study was approved by the University Institutional Review Board. All guardians provided written consent prior to child study enrollment.
2.1. Study Design
Children reported to research facilities twice for this study. On the first visit, parents completed questionnaires on child health and medication use. The Social Communication Questionnaire (SCQ) was used as a dimensional assessment of ASD symptoms and overall social communication abilities [19]. The Short Sensory Profile was used to assess sensory processing patterns [20]. Depending on their child’s age, parents were administered either the Adaptive Behavior Assessment System, 3rd edition (ABAS-3 for children ≥5 years of age) or the Vineland Adaptive Behavior Scales, 2nd edition (for children <5 years of age) [21,22]. Following questionnaires, parents were given a digital BP machine for home use (iProven BPM-634, Denver, CO, USA). Parents returned the device 1 week later at the second visit, which consisted of measurement of child office BP and anthropometrics.
2.2. Home Blood Pressure
Parents were instructed to take two consecutive measures in the morning and two consecutive measures in the evening every day for seven consecutive days. Self-reported BP values from a 7-day log were used for subsequent analyses.
2.3. Anthropometrics
Height and weight was measured in duplicate using a stadiometer and an electronic scale (Tanita SC-240, Arlington Heights, IL, USA) and averaged for final analyses. Body Mass Index (BMI) was calculated as weight (kg)/height (m)2 and expressed according to age- and sex-specific percentiles. Overweight/obesity was categorized as a BMI > 90th percentile. Height was expressed according to age- and sex-specific percentiles.
2.4. Office Blood Pressure
“Office” measures were conducted in a research laboratory setting. BP was measured using the same digital automated oscillometric device (iProven BPM-634, Denver, CO, USA) with the child in the seated position and the right arm elevated and supported at heart level.
2.5. Analyses
Data are presented as mean ± SD. All home BP readings were averaged to give a single reading for Mean Systolic BP (SBP) and Diastolic BP (DBP) as well as AM_SBP and AM_DBP (for morning measures) and PM_SBP and PM_DBP (for evening measures). For office BP, the average of two recordings (where appropriate) were used for subsequent analyses. Feasibility was assessed as the percentage of home BP measures completed by parents over a 7-day period. Home monitoring was considered successful (i.e. feasible) if parents were able to obtain >70% of measures. Differences between variables of interest were computed via dependent t-tests. Univariate associations of interest were computed via Pearson’s Correlation Coefficients. Binary logistic regression was used for exploratory analyses to examine office vs. home BP in predicting overweight/obesity status.
Intra-class Correlation Coefficients (ICC) were computed to determine the reliability of the collected data using SAS version 9.4 (SAS Institute, Cary, NC, USA). A macro that uses PROC GLM was used to calculate ICC(2,k) [23]. ICC(2,k) was chosen because the days that the participants were tested were a random selection. Generalizability theory was used to determine the optimal data collection structure. Generalizability theory is an extension of intra-class reliability and analysis of variance which is typically divided into two parts, the G-study and the D-study [24]. The G-study is used to quantify the proportion of variance associated with each facet and its interactions. For the G-study, participant (P) and day (D) and measurements (M) were considered random facets in a fully crossed design (P × D × M). Reliability analyses following the generalizability theory framework was conducted using RStudio version 1.1.447 (RStudio, Inc. Boston, MA, USA). Variance components corresponding to P, D, and M for SBP and DBP metrics were estimated using restricted maximum likelihood with the ‘lme4’ package’s ‘lmer’ function in R [25]. Using the aforementioned estimated variance components, a D-study was subsequently conducted to calculate the generalizability coefficients (G), which can be interpreted in the same manner that ICCs values are interpreted.
3. RESULTS
Descriptive characteristics and BP results are presented in Table 1. Questionnaires were not completed for one child. Home BP was not assessed in two children. Office BP could not be assessed in the same two children. Of the 16 children with BP recordings, all had a lifetime SCQ > 11 (range 12–34). Eight of these children were considered overweight/obese based on age- and sex-adjusted BMI percentiles. Three children were taking prescription medications: one child was taking antipsychotics and anti-depressants (Ziprasidone, Aripiprazole, Fluoxetin), and two children were taking medication for attention deficit hyperactivity disorder (Guanfacine, Adderall). Additionally, two children were taking over-the-counter agents for allergies (Cetirizine and Fluticasone, as needed).
| Mean ± SD | |
|---|---|
| Age (years) | 7 ± 3 |
| SCQ (n = 17) | |
| Current | 15 ± 4 |
| Lifetime | 20 ± 6 |
| Short sensory profile (n = 17) | |
| Tactile sensitivity | 28 ± 5 |
| Taste/smell sensitivity | 13 ± 6 |
| Movement sensitivity | 13 ± 3 |
| Under-responsive/seeks sensation | 19 ± 6 |
| Auditory filtering | 17 ± 4 |
| Low energy/weak | 20 ± 7 |
| Visual/auditory sensitivity | 18 ± 4 |
| ABAS (n = 14) | |
| Conceptual | 82 ± 15 |
| Social | 80 ± 11 |
| Practical | 84 ± 15 |
| General adaptive composite | 81 ± 14 |
| Vineland (n = 3) | |
| Communication | 78 ± 23 |
| Daily living skills | 72 ± 21 |
| Socialization | 77 ± 17 |
| Motor skills | 77 ± 7 |
| Adaptive behavior composite | 73 ± 17 |
| Height (cm) | 123.1 ± 16.6 |
| Height (percentile) | 55 |
| Weight (kg) | 29.7 ± 14.9 |
| BMI (kg/m2) | 18.5 ± 4.8 |
| BMI (percentile) | 66 |
| Blood pressure (n = 16) | |
| Office systolic blood pressure (mmHg) | 107 ± 11 |
| Office diastolic blood pressure (mmHg) | 68 ± 7 |
| Home systolic blood pressure AM (mmHg) | 110 ± 11 |
| Home diastolic blood pressure AM (mmHg) | 69 ± 7 |
| Home systolic blood pressure PM (mmHg) | 109 ± 9 |
| Home diastolic blood pressure PM (mmHg) | 69 ± 7 |
SCQ, Social communication questionnaire; ABAS, adaptive behavior assessment system; BMI, body mass index.
Child descriptive characteristics
Mean number of recordings in children (n = 16) were 22 (of 28 total). Eleven parents were able to obtain >75% of measures with eight of those 11 parents obtaining >90% of measures. The remaining five parents were able to obtain between 11 and 15 measures. Office BP was successfully measured in 16 children.
There were no statistical differences between mean office SBP and mean home SBP (p = 0.46) or mean office DBP and mean home DBP (p = 0.68). The correlation between home SBP and office SBP was r = 0.44 (p = 0.023). The correlation between home DBP and office DBP was r = 0.43 (p = 0.050). In those children that had two office BPs completed (n = 8), there were no differences between SBP recordings (102 ± 6 vs. 102 ± 6 mmHg, p = 0.89) or DBP recordings (67 ± 4 vs. 67 ± 10 mmHg, p = 0.92). There were no correlations between age, SCQ scores and the total number of measures completed or the difference between office and home measures (p > 0.05). Home SBP associated with age (r = 0.40, p < 0.05), height (r = 0.53, p < 0.05) and BMI (r = 0.68, p < 0.05). Office SBP was associated with height (r = 0.44, p < 0.05) but not age (r = 0.30, p > 0.05) or BMI (r = 0.33, p > 0.05).
When children were separated into two groups based on BMI percentiles, overweight/obese children with ASD had significantly higher home SBP compared with normal weight children with ASD (115 ± 8 vs. 103 ± 7 mmHg, p < 0.05). There were no group differences in office SBP, DBP or home DBP (p > 0.05). According to binary logistic regression, home SBP was able to predict overweight/obesity classification (β = 0.209, Wald 4.19, CI 1.000–1.506, p = 0.044). Office SBP was not able to predict overweight/obesity classification (β = 0.047, Wald 0.85, CI 0.948–1.159, p = 0.354).
Intra-class correlation coefficients for the collected data were 0.92 for both SBP and DBP. The G-Study indicated that approximately 30% of the variance was attributed to the participants while approximately 10–13% was attributed to the interaction between participant * day. The other facets did not have major contribution to the variance leaving a large portion unexplained (see Table 2). The results from the D-Study are shown in Figure 1. The results were similar for SBP and DBP, indicating that 3 days with 4 measurements/day could be sufficient to achieve a G > 0.8.
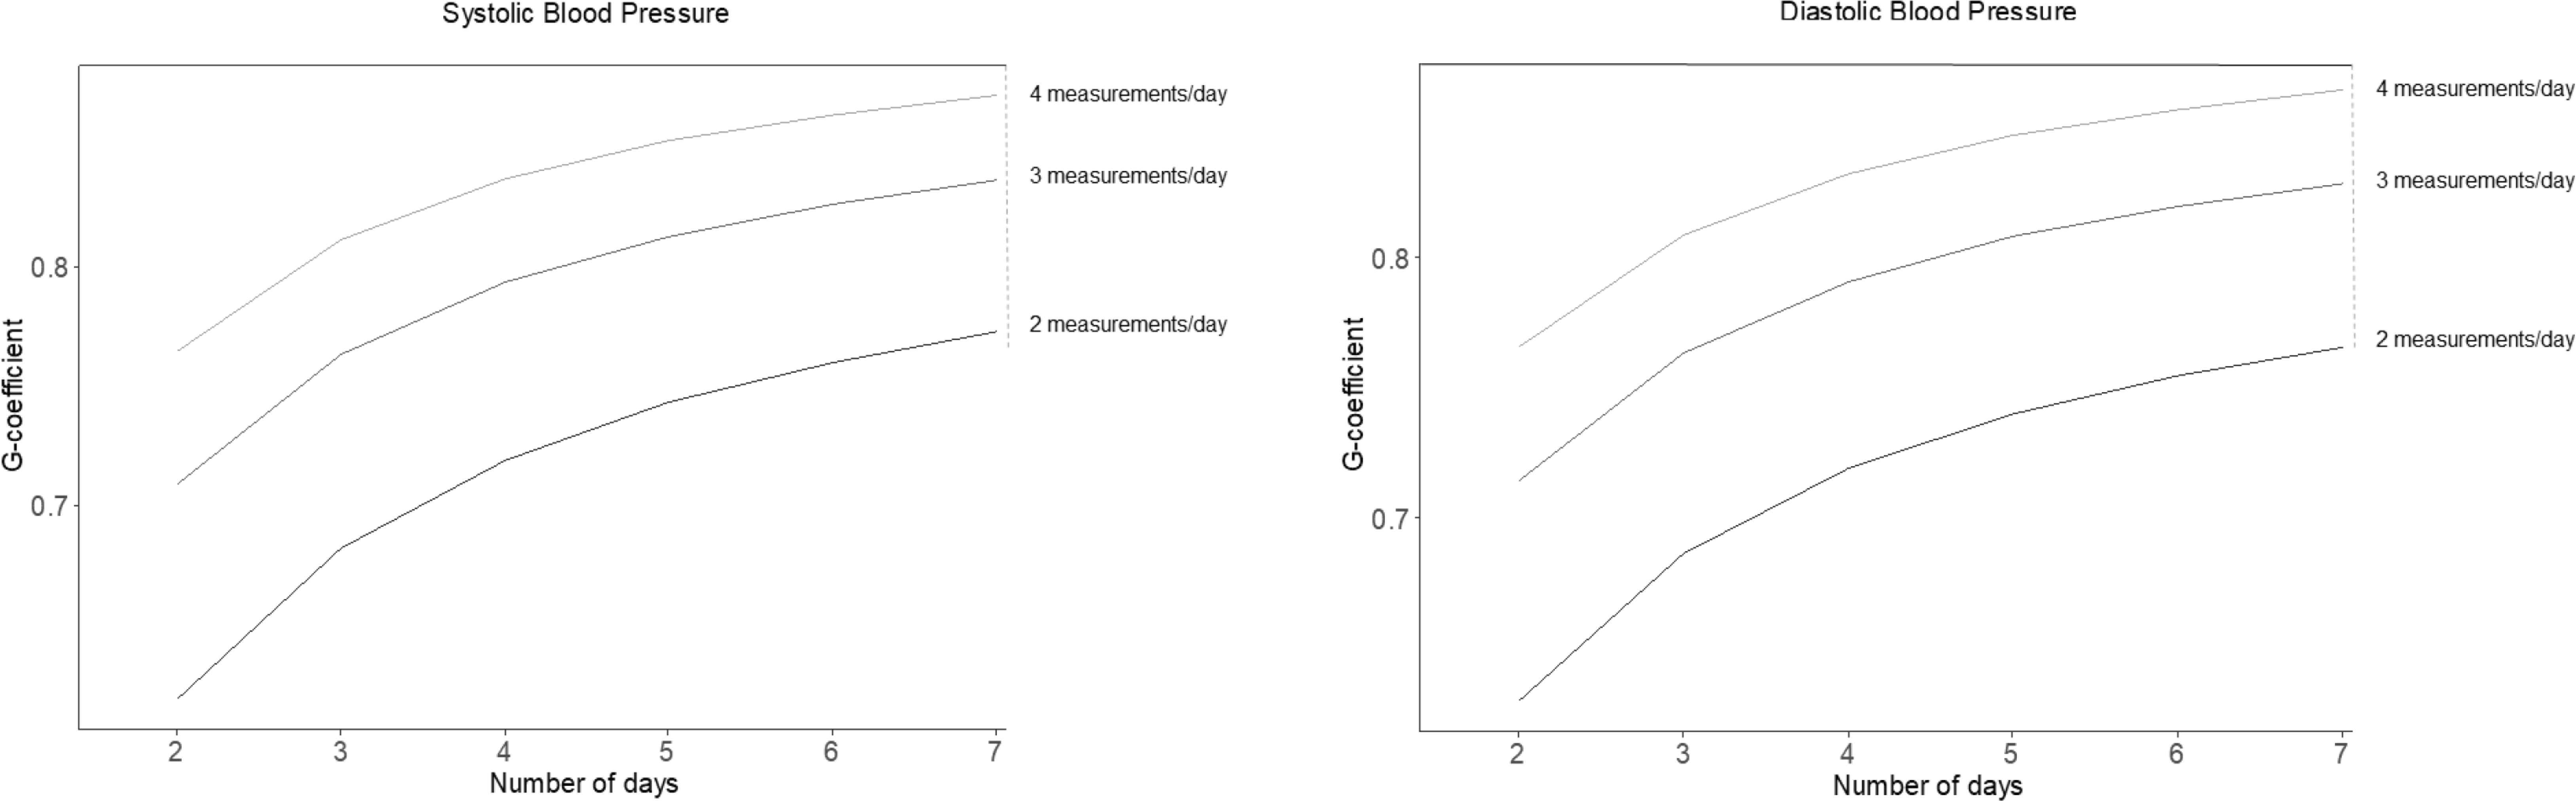
Reliability results from the D-Study according to number of measurement days and number of measurements made each day. For example, taking 4 measurements/day for 2 days would yield a similar reliability as performing 2 measurements/day for 7 days (G-coefficient 0.76).
| Facet | SBP | DBP | ||
|---|---|---|---|---|
| Variance | Percentage | Variance | Percentage | |
| Participant | 81.08 | 31.4 | 36.75 | 33.2 |
| Day | 2.72 | 1.1 | 0.87 | 0.8 |
| Measurement | 0.29 | 0.1 | 0.00 | 0 |
| Participant * Day | 26.85 | 10.4 | 14.25 | 12.9 |
| Participant * Measurement | 0.00 | 0 | 1.78 | 1.6 |
| Measurement * Day | 1.24 | 0.5 | 2.63 | 2.4 |
| Residual | 146.14 | 56.6 | 54.52 | 49.2 |
Intra-class correlation coefficient analyses (n = 16)
4. DISCUSSION
This study provides the first evidence that home BP monitoring is feasible in children with ASD. Approximately 70% of parents provided at least 75% of the expected 7-day home BP recordings. Home and office BP did not differ and were correlated. However, individual differences between home and office measures were high and did not yield similar insight into potential hemodynamic status in children with ASD. Compared with office BP, home BP better associated with known correlates of BP including age, height and BMI. Performing 4 measurements/day (twice in the morning and twice in the evening) for 3 days provided reliable BP information in children with ASD.
Consistent with patterns seen in typically developing children [26], SBP increased with increasing age and height in children with ASD. In our study, home SBP was more strongly associated with age and height in children with ASD than office SBP. Home SBP and DBP were also more strongly correlated with BMI than office measures in children with ASD as consistent with the literature [13]. Thus, home BP monitoring may offer more refined insight into hemodynamic status in children with ASD. The poor association of DBP with age and height is consistent with previous findings in typically developing children [26]. The reason for this may relate to measurement error and/or inherent characteristics of the oscillmetric method for assessing BP [27]. Oscillometric cuff-based methods tend to overestimate the measure DBP in adults and children alike when compared to invasive intra-arterial recordings [28]. Weaker pulses and different pulse wave morphology in children (owing to differences in arterial distensibility and pressure wave reflection/amplification) likely alter the shapes of the oscillometric pulse amplitude envelopes and their ratios [27], affecting derivation of absolute diastolic pressures.
Children with ASD are at a particularly high risk for obesity. Previous studies have reported prevalence of overweight/obesity to be ~30% in children with ASD and children with ASD are four times more likely to be overweight/obese compared with typically developing children [16–18]. Approximately half of children in the present study were overweight/obese according to sex-, age-adjusted percentiles. Obesity is associated with numerous CVD risk factors in childhood and is a risk factor for CVD in adulthood. Consistent with previous reports in typically developing children [13], we noted that home BP was more strongly correlated with overweight/obesity status in children with ASD than office measures. Moreover, home SBP was more strongly associated with overweight/obesity status than DBP and this too is consistent with the literature [13]. Overweight/obesity appears to preferentially impact SBP more so than DBP in children. Thus, although the clinical significance of home BP monitoring in children with ASD remains to be determined, our findings suggest potential utility as a marker of CVD risk related to overweight/obesity status.
As a first study of its kind, we chose to ask parents to record BP for seven consecutive days in their child with ASD. Stergiou et al. has found that 3-day home monitoring with duplicate morning and evening measurements is sufficiently reliable for home BP appraisal in typically developing children [29]. Based on our results, 3 days of monitoring with 4 measurements/day may also be sufficient for children with ASD. Additional studies are needed in larger samples to confirm our findings. Home BP in typically developing children is related to target organ damage such as increased arterial stiffness and we recently confirmed that BP is strongly associated with arterial stiffness in children with ASD [10]. Additional research is needed to confirm if home BP is a better indicator of target organ damage in children with ASD than office BP. Finally, home BP may afford an opportunity to familiarize children with ASD to the process of BP measurement, lowering anxiety associated with office measures. Although our study was not designed to assess the direct effect of home BP monitoring on subsequent success of office based measures, we were able to successfully measure office BP in 16/18 children with ASD in this study compared with 19/30 in previous attempts [10].
In addition to small sample size, there was potential for recruitment bias. Participants that volunteered to be in the study likely represent a subgroup of child-parent dyads who are more likely/more willing to complete home BP monitoring. We relied on parental recording of BP using a daily log for all analyses. Future studies should utilize the BP device’s memory capacity to objectively recall all BP recordings. For office BP measures, we recorded a single measure in most children with ASD. Owing to time constraints of study design, we did not perform additional measures in all children. Additional BP recordings (at least 3 measurements in the same sitting) may improve accuracy of BP assessment in children [30].
In conclusion, home BP monitoring is feasible and reliable in children with ASD and better associates with established hemodynamic correlates (age, height and BMI) when compared with office BP measurement. A minimum of 3 days of measurement with 4 measurements/day provides reliable BP in children with ASD.
CONFLICTS OF INTEREST
The authors declare they have no conflicts of interest.
AUTHORS’ CONTRIBUTION
KSH contributed in study design with an emphasis on blood pressure measurement, data reduction of BP results, statistical analyses, interpretation of results, manuscript preparation (including genesis of data tables). TVB contributed in study design, statistical analyses, interpretation of results, manuscript preparation (including genesis of data figures). LC contributed in study design, participant recruitment, participant consenting, manuscript preparation. NR contributed in study design with an emphasis on measures related to ASD, data analyses of ASD-related behavioral questionnaires, interpretation of behavioral data, manuscript preparation. LP, PP, JD, AP and GR contributed in participant scheduling, data collection, data reduction, manuscript preparation and editing.
FUNDING
The support for this study was provided by
Footnotes
REFERENCES
Cite this article
TY  - JOUR
AU  - Kevin S. Heffernan
AU  - Luis Columna
AU  - Laura Prieto
AU  - Patricia Pagan
AU  - Jacob DeBlois
AU  - Alyssa Prawl
AU  - Gianpietro Revolledo
AU  - Natalie Russo
AU  - Tiago V. Barreira
PY  - 2019
DA  - 2019/12/02
TI  - Home Blood Pressure Assessment in Children with Autism Spectrum Disorder: A Feasibility Study
JO  - Artery Research
SP  - 145
EP  - 149
VL  - 25
IS  - 3-4
SN  - 1876-4401
UR  - https://doi.org/10.2991/artres.k.191123.001
DO  - 10.2991/artres.k.191123.001
ID  - Heffernan2019
ER  -