
Assessment of Arterial Stiffness Index Calculated from Accelerated Photoplethysmography
- DOI
- 10.2991/artres.k.191120.001How to use a DOI?
- Keywords
- Arterial stiffness; endovascular therapy; baPWV; arterial stiffness index
- Abstract
Objective: An Arterial Stiffness Index (ASI) can be obtained by measuring finger photoplethysmogram using the SB200 pulse oximeter, giving a level between 1 and 6. However, it was unclear whether this method accurately reflected arterial stiffness. Brachial–Ankle Pulse Wave Velocity (baPWV) is an established method for the assessment of arterial stiffness, allowing us to compare baPWV and our own ASI.
Methods: We retrospectively collected data from 18 patients scheduled for neuroendovascular therapy in the Department of Neurosurgery at Osaka University Hospital between March 2016 and December 2016, for whom both baPWV and SB200 measurements were performed prior to their procedure. This allowed us to assess the relationship between the ASI and the baPWV. We defined patients with an ASI ≥ 3 on the SB200 as the progressed arterial stiffness group, while patients with a level of ≤2 were considered normal. BaPWV was compared across the two groups. We also analyzed the receiver operating characteristic curve for predicting baPWV values ≥ 1700 cm/s by the ASI measurement.
Results: The progressed arterial stiffness group showed significantly higher baPWV values (p = 0.0087). The area under the curve for the ASI was 0.84. The ASI of 3 had a sensitivity of 71.4% and a specificity of 90.1% for predicting baPWV ≥ 1700 cm/s.
Conclusion: We conclude that the non-invasive and portable SB200 device successfully measured arterial stiffness.
- Copyright
- © 2019 Association for Research into Arterial Structure and Physiology. Publishing services by Atlantis Press International B.V.
- Open Access
- This is an open access article distributed under the CC BY-NC 4.0 license (http://creativecommons.org/licenses/by-nc/4.0/).
1. INTRODUCTION
Arterial stiffness has previously been identified as an independent predictor of neuro/cardiovascular diseases and events [1,2]. Recent technological advances for the assessment of arterial stiffness have helped with early identification and prevention of neuro/cardiovascular disease/events in at-risk patients. Several non-invasive methods have been developed recently for the assessment of arterial stiffness. Brachial–Ankle Pulse Wave Velocity (baPWV) is non-invasive and convenient, and so it is widely used in clinical practice and in large populations [3,4].
Another method for evaluating arterial stiffness is Accelerated Photoplethysmography (APG) [5]. APG is obtained from the second derivative wave of fingertip photoplethysmography, and is a simpler and more convenient technique for the analysis of arterial stiffness [5,6]. The SB200 (MURANAKA, Osaka, Japan) is a portable finger pulse oximeter, which can measure APG simultaneously with arterial oxygen saturation. An Arterial Stiffness Index (ASI) is also calculated automatically with APG. However, the ASI measurement obtained by the SB200 has not been validated to reflect arterial stiffness.
Neuroendovascular therapy is widely accepted as an alternative to direct surgery, as technological improvements in neuroendovascular devices have dramatically improved its safety. However, the complications of thromboembolism after neuroendovascular therapy still represent a major problem. We have recently reported that severe arterial stiffness was predictive of cerebral thromboembolisms after carotid artery stenting [7]. Therefore, it was important in the present study to assess arterial stiffness before neuroendovascular therapy. Our aim was to validate the ASI measurements obtained with the SB200, by comparing them with baPWV measurements taken from patients prior to having neuroendovascular therapy.
2. MATERIALS AND METHODS
This study was approved by the ethics committee of our Institutional Review Board (approval number 16517-2).
2.1. Participants and Data Collection
Eighteen patients who received non-emergent neuroendovascular therapy in the Department of Neurosurgery at Osaka University Hospital between March 2016 and December 2016 were enrolled in this study. We assessed arterial stiffness using both the pulse oximeter SB200 and the baPWV before neuroendovascular therapy. We collected clinical data comprising age, sex and body mass index. Medical records were assessed for information of relevant previous medical history (comprising hypertension, dyslipidemia, diabetes, and current or past smoking habits). Preoperative blood pressure, heart rate, and laboratory data were also assessed from medical records.
2.2. Arterial Stiffness Index Measured with the SB200
Accelerated photoplethysmography was measured in the supine position using the SB200 pulse oximeter (MURANAKA, Osaka, Japan), with all recordings taken from the participants’ middle fingers. The ASI measurement was taken automatically by the SB200 over a period of 1 min. Measurements were classified according to six levels ranging from level 1 (excellent condition) to level 6 (poor condition) (Figure 1).
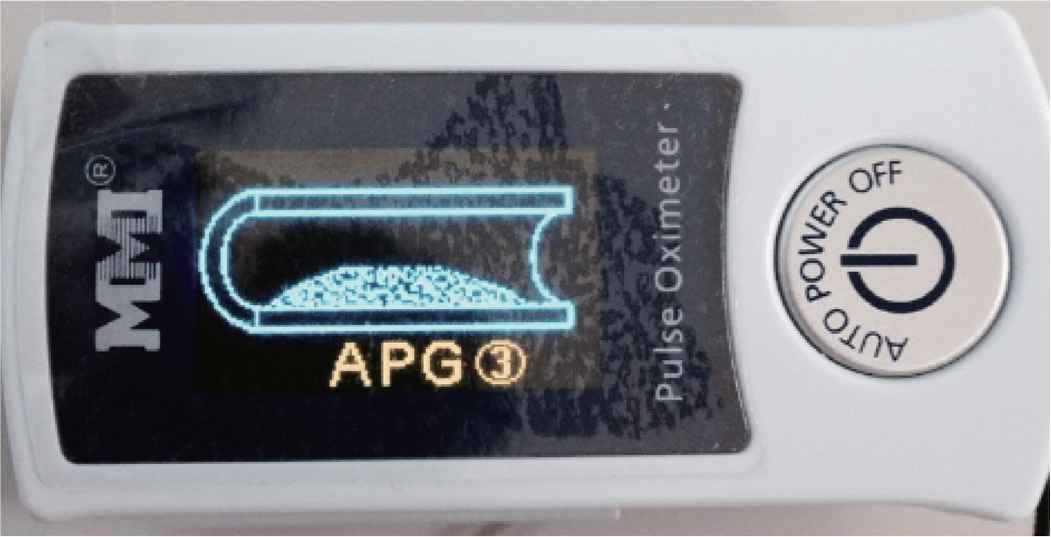
Arterial stiffness index using the pulse oximeter SB200 device. The SB200 pulse oximeter also gives the ASI, which is again classified in six levels, with level 1 representing excellent condition and level 6 representing poor condition.
2.3. BaPWV Measurement
Brachial–ankle pulse wave velocity was performed as previously described [7]. BaPWV was measured with a volume-plethysmographic apparatus (BP-203RPE III; Colin-Omron, Co., Ltd., Tokyo, Japan). This device records PWV, blood pressure, electrocardiogram, and heart sounds concurrently. Patients were examined in the supine position, with recording cuffs attached to both brachia and ankles. Electrocardiographic electrodes were attached to both wrists. The microphone for recording heart sounds was placed on the left sternal border. This device recorded each patient’s pulse volume waveforms at the brachium and ankle after a few minutes of rest. The distance between the point of measurement and the patient’s heart was automatically calculated according to the patient’s height. The time difference from the wave front of the brachial waveform to the wave front of the ankle waveform was measured. BaPWV values reflected velocity, which was calculated as the difference between the heart–ankle distance and the heart–brachium distance, divided by this time difference. Recordings from either the left or right sides were used in statistical analyses, depending upon which values were higher [8].
2.4. Statistical Analyses
We regarded patients with an ASI ≥ 3 on the SB200 as the ‘progressed arterial stiffness group’, while patients with an ASI ≤ 2 were regarded as the normal group. BaPWV was compared across the two groups using non-parametric Wilcoxon rank sum tests. We also analyzed the Receiver Operating Characteristic (ROC) curve. As previous reports indicated that a baPWV value of ≥1700 cm/s was considered as progressed severe arterial stiffness [9], we also regarded baPWV ≥ 1700 cm/s as indicative of progressed arterial stiffness. ROC curves for predicting baPWV ≥ 1700 cm/s by ASI measurements were constructed. We also explored Area under the Curves (AUCs). Significant differences were considered at a threshold of p < 0.05. JMP software (JMP Pro 11.2.0, SAS Institute Inc., SAS Campus Drive, Cary, NC, USA 27513-2414) was used for all statistical analyses.
3. RESULTS
3.1. Patient Characteristics
Table 1 shows the patient characteristics. The mean age was 65.2 ± 11.5 years, and 55.6% were male. The mean BMI was 23.7 ± 3.6 kg/m2. The mean baPWV was 1585.8 ± 254.5 cm/s. Mean ASI using the SB200 was 2.6 ± 1.1, and an ASI ≥ 3 was observed in six patients (33.3%). In terms of vascular risk factors, 10 patients had a history of hypertension (55.6%), and eight patients had a history of smoking (44.4%). Of the 18 patients, five had a cerebral aneurysm, six had carotid artery stenosis, six had an intracranial tumor, and one patient had dural arteriovenous fistula.
| Variables | |
|---|---|
| Age, years (mean ± SD) | 65.2 ± 11.5 |
| Gender male [n (%)] | 10 (55.6) |
| BMI (kg/m2) (mean ± SD) | 23.7 ± 3.6 |
| SBP (mmHg) (mean ± SD) | 132.5 ± 16.4 |
| DBP (mmHg) (mean ± SD) | 74.1 ± 12.7 |
| HR (bpm) (mean ± SD) | 66.7 ± 8.9 |
| baPWV (cm/s) (mean ± SD) | 1585.8 ± 254.5 |
| ASI using SB200 (mean ± SD) | 2.6 ± 1.1 |
| Treatment, n (%) | |
| Cerebral aneurysm | 5 (27.8) |
| Carotid artery stenosis | 6 (33.3) |
| Tumor | 6 (33.3) |
| Dural arteriovenous fistula | 1 (5.6) |
| Risk factors, n (%) | |
| Smoking history | 8 (44.4) |
| Hypertension | 10 (55.6) |
| Diabetes | 3 (16.7) |
| Dyslipidemia | 2 (11.1) |
| Laboratory data (mean ± SD) | |
| TC | 190.4 ± 47.1 |
| TG | 190.5 ± 210.3 |
| Glu | 115.2 ± 33.4 |
BMI, body mass index; SBP, systolic blood pressure; DBP, diastolic blood pressure; HR, heart rate; baPWV, brachial–ankle pulse wave velocity; ASI, arterial stiffness index; TC, total cholesterol; TG, triglyceride; LDL, low-density lipoprotein; Glu, glucose.
Patient characteristics
3.2. Arterial Stiffness Index and baPWV
Arterial stiffness index levels ≥3 were significantly associated with a higher baPWV on the Wilcoxon rank sum test (p = 0.0087) (Figure 2). Figure 3 shows the ROC curves for predicting baPWV ≥ 1700 cm/s by ASI measurement. The AUC of the ASI for patients with a baPWV ≥ 1700 cm/s was 0.84. The ASI cutoff of 3 had a sensitivity of 71.4% and a specificity of 90.1% for predicting baPWV ≥ 1700 cm/s.
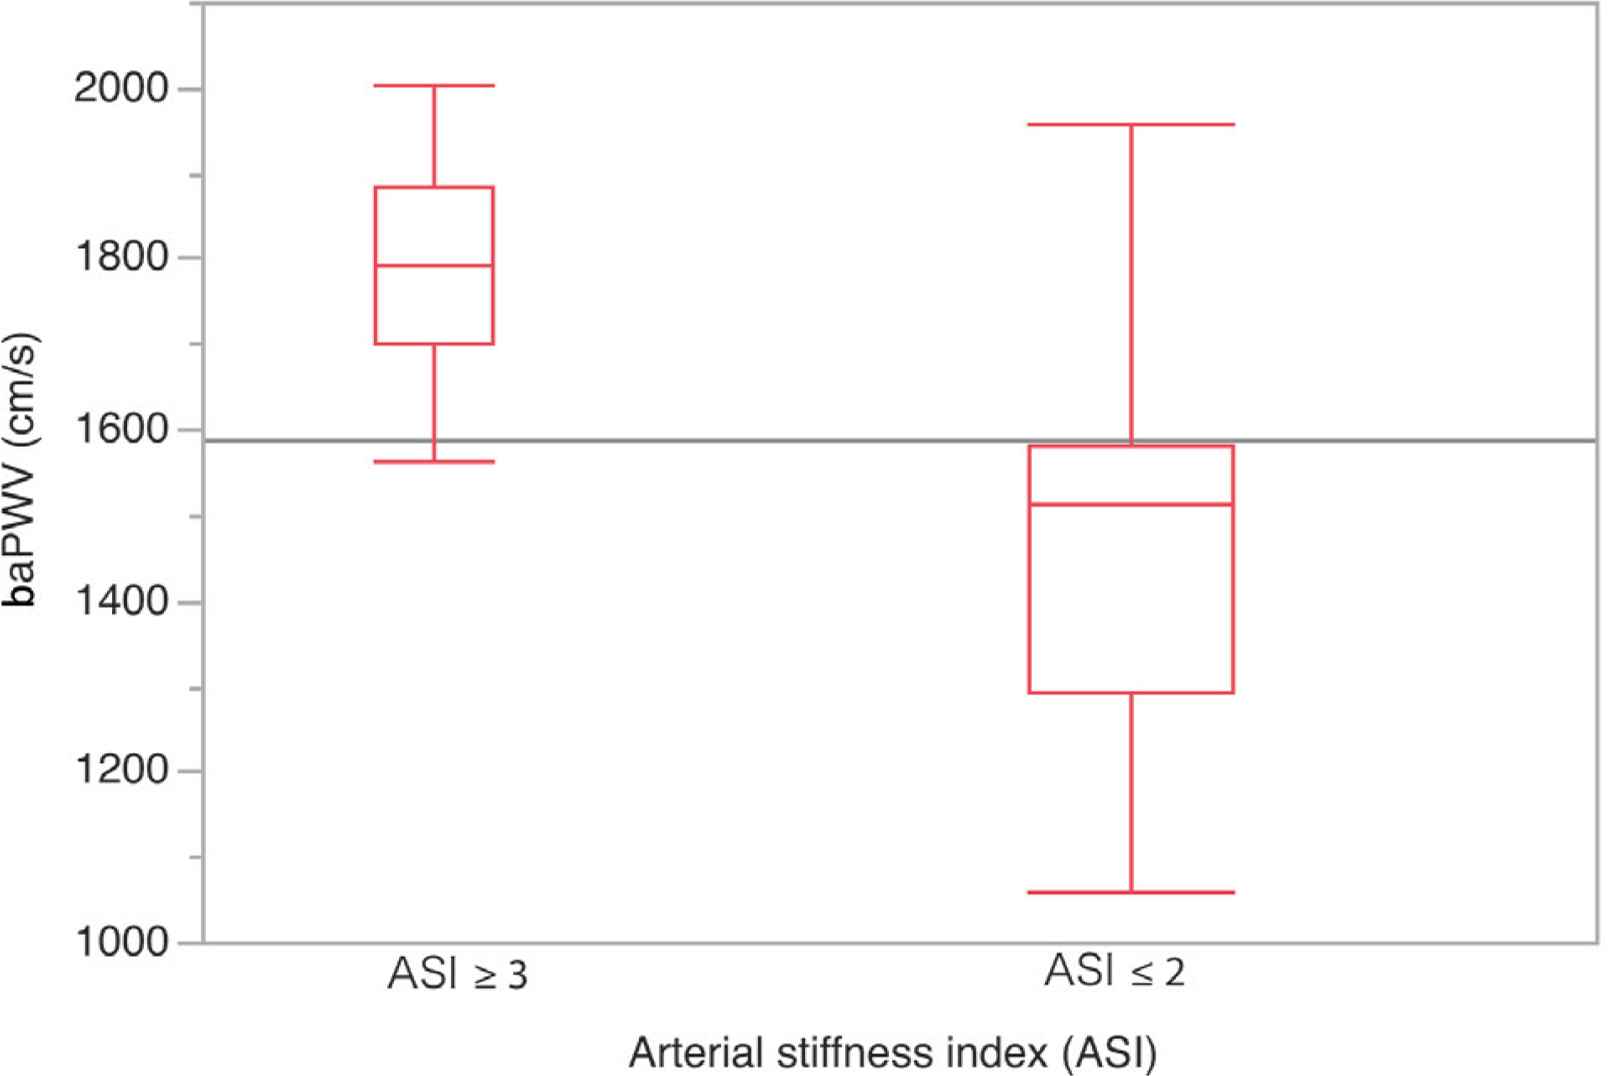
Correlation between Arterial Stiffness Index (ASI) ≥ 3 and Brachial–Ankle Pulse Wave Velocity (baPWV). ASI ≥ 3 positively and significantly correlated with baPWV (p = 0.0087).
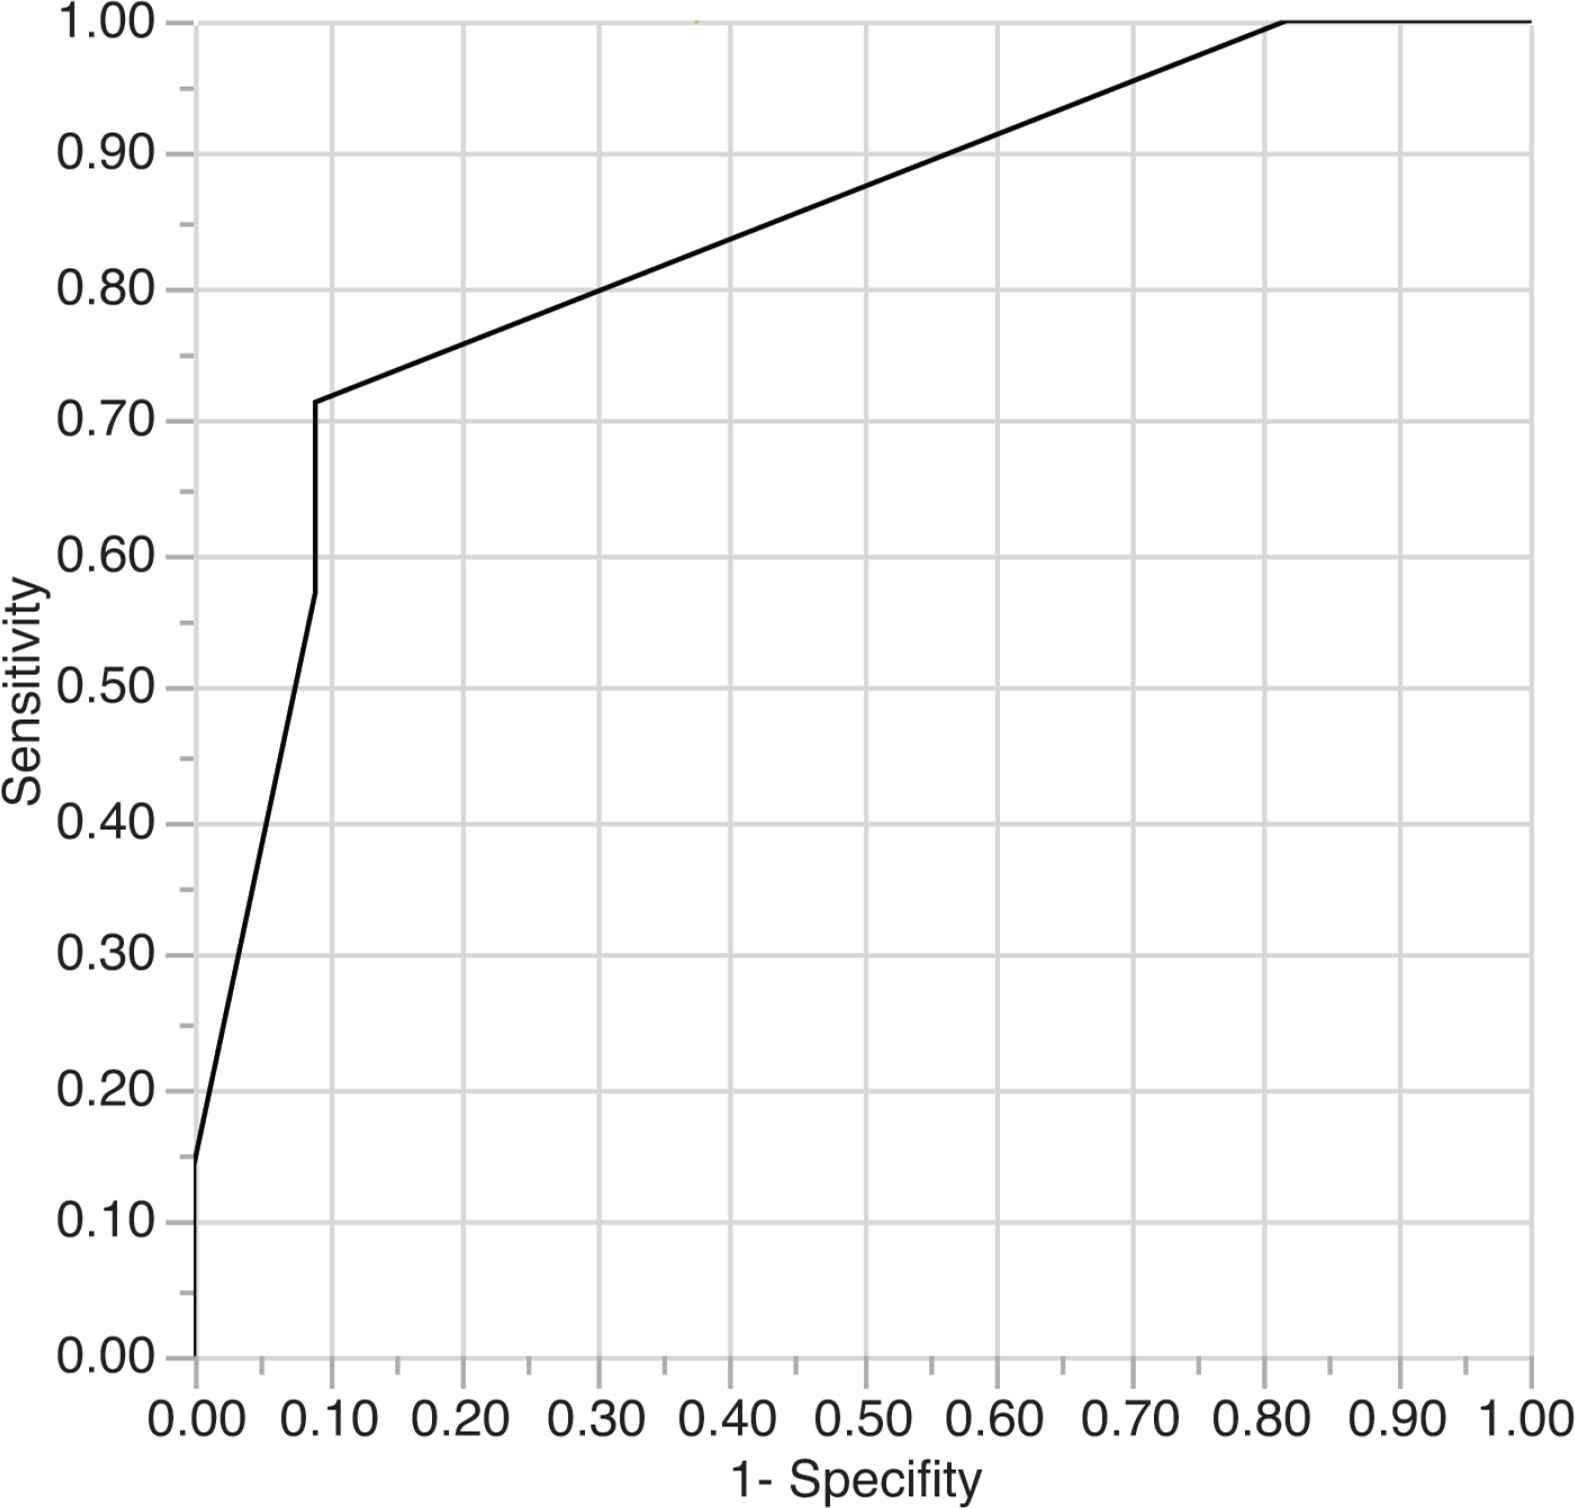
Receiver operating characteristic curves for Brachial–Ankle Pulse Wave Velocity (baPWV) ≥ 1700 cm/s and Arterial Stiffness Index (ASI). The area under the curve for the ASI for patients with a baPWV ≥ 1700 cm/s was 0.84. The ASI cutoff of 3 had a sensitivity of 71.4% and a specificity of 90.1% for predicting baPWV ≥ 1700 cm/s.
4. DISCUSSION
Assessing arterial stiffness is important, as arterial tortuosity and plaques may impede catheter placement in patients with progressed arterial stiffness. If there is heavy arterial tortuosity and many plaques in the access route, the risk of thromboembolism by catheter manipulation is predicted to increase [7]. BaPWV is a proven method for the assessment of arterial stiffness. In this study, we assessed ASI measured with the SB200, directly comparing the measurements obtained with those taken with the baPWV. Our findings show that an ASI level ≥3 obtained with the SB200 was positively correlated with higher baPWV measurements.
The APG is measured by double differentiation of the finger photoplethysmogram. There are four systolic waves and one diastolic wave in the waveform of the APG (Figure 4). Systolic waves consist of a, b, c, and d waves. The diastolic wave is the ‘e’ wave [10]. The shape of the APG waveform has been previously categorized into seven types (from type A to type G) according to different variations in the height of the b, c, and d waves relative to the height of the a wave [10,11]. For instance, the amplitude of the b wave is lower than the c wave in type A, which indicates healthy functioning. Type G is the lowest grade and is frequently seen in patients with atherosclerotic diseases, for whom the amplitude of the b wave is higher than the c wave [10].
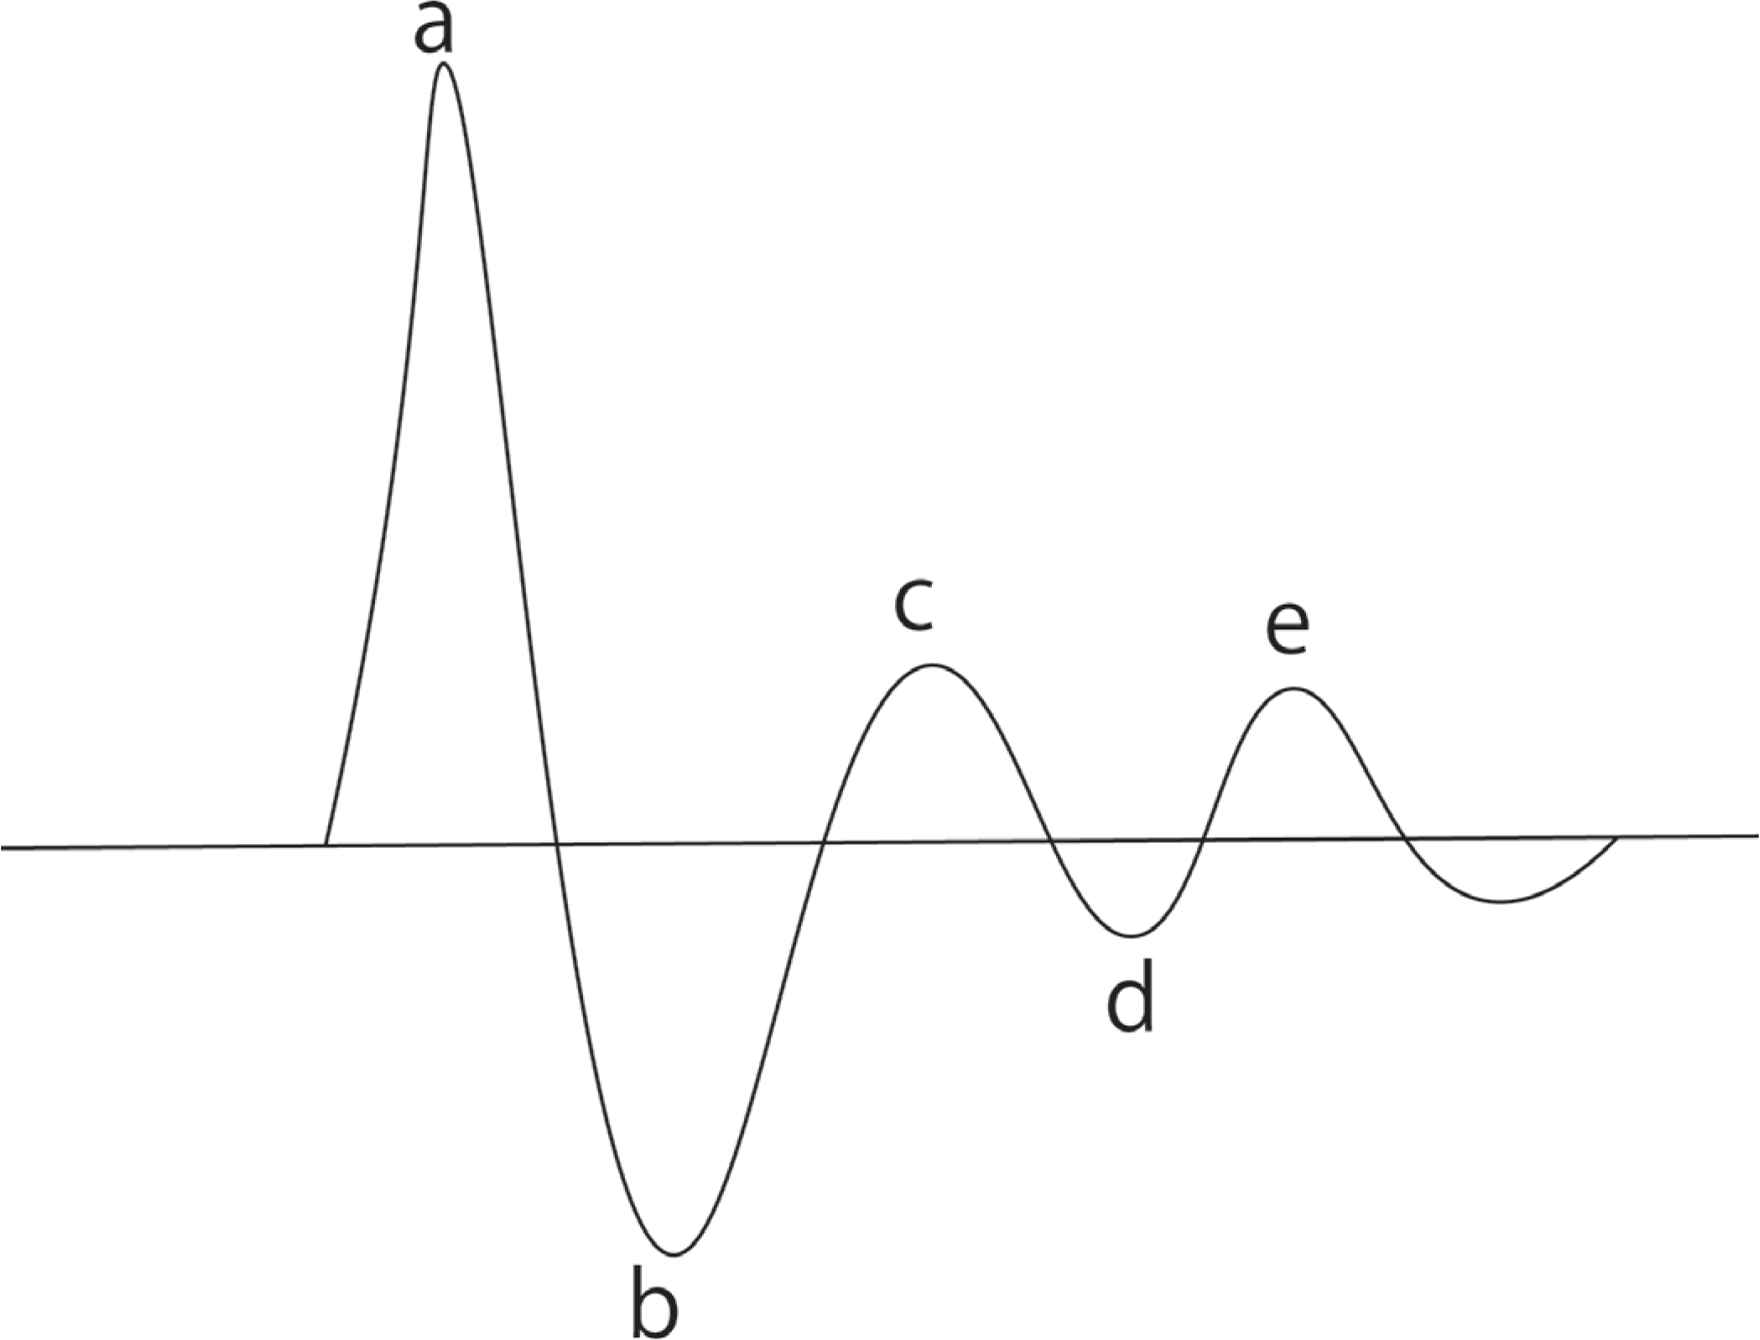
Accelerated Photoplethysmography (APG) waveform. Four systolic waves and one diastolic wave are seen in the APG waveform. The a wave is a systolic early positive wave, the b wave is a systolic early negative wave, the c wave is a systolic late reincreasing wave, the d wave is systolic late redecreasing wave, and the e wave is a diastolic early positive wave.
The SB200 device generates six ASI levels. Each level from 1 to 5 was equivalent to types A to E described above, in ascending order. Level 6 corresponded to types F and G described here. This reliability has been corroborated by a clinical study at the National Taiwan University Hospital [12]. In that study, coronary heart disease patients had significantly higher ASI (>2.46). Our findings are consistent with this result, as the group of subjects with an ASI ≥ 3 positively correlated with higher baPWV, and had moderate accuracy for predicting baPWV ≥ 1700 cm/s according to the AUC analysis. Furthermore, our analysis also showed that the cut-off value of the ASI for the baPWV ≥ 1700 cm/s was 3. As a baPWV > 1700 cm/s is associated with an increased risk of cardiovascular disease and all-cause mortality [9,13,14], an ASI ≥ 3 could feasibly be regarded as representative of progressed arterial stiffness.
In summary, our results suggest that an ASI level of ≥3 could reflect progressed arterial stiffness. Nevertheless, there were two main limitations associated with the present study. First, we had a relatively small sample size. Second, the relationship between arterial stiffness and cerebrovascular events during neuroendovascular therapy remains to be elucidated fully. Therefore, further investigation is required to clarify the significance of assessment of arterial stiffness using the SB200 prior to neuroendovascular therapy.
5. CONCLUSION
Arterial stiffness index measurements taken using the SB200 device were positively correlated with baPWV before neuroendovascular therapy.
CONFLICTS OF INTEREST
The authors declare they have no conflicts of interest.
AUTHOR CONTRIBUTIONS
TM and KA study conceptualization and writing (review and editing) the manuscript, TM and YK Data curation, formal analysis and writing (original draft), TN, HN and HK supervised the project.
INFORMED CONSENT
This study was approved by the ethics committee of Osaka University Institutional Review Board (approval number 16517-2). We got informed consent by writing clearly on the homepage because this study was non-invasive and observational. http://www.nsurg.med.osaka-u.ac.jp/school/pdf/EmboliRisk201704.pdf.
Footnotes
REFERENCES
Cite this article
TY  - JOUR
AU  - Tomoaki Murakami
AU  - Katsunori Asai
AU  - Yoshinori Kadono
AU  - Takeo Nishida
AU  - Hajime Nakamura
AU  - Haruhiko Kishima
PY  - 2019
DA  - 2019/12/02
TI  - Assessment of Arterial Stiffness Index Calculated from Accelerated Photoplethysmography
JO  - Artery Research
SP  - 37
EP  - 40
VL  - 25
IS  - 1-2
SN  - 1876-4401
UR  - https://doi.org/10.2991/artres.k.191120.001
DO  - 10.2991/artres.k.191120.001
ID  - Murakami2019
ER  -