
Integrated Central Blood Pressure-aortic Stiffness Risk Categories and Cardiovascular Mortality in End-stage Renal Disease
These authors contributed equally to this work and are considered shared last authors.
- DOI
- 10.2991/artres.k.191114.004How to use a DOI?
- Keywords
- End-stage renal disease; integrated central blood pressure-aortic stiffness risk score; arterial stiffness; central blood pressure; central pulse pressure; pulse wave velocity
- Abstract
Background: Our aim was to study the predictive power of integrated central blood pressure-aortic stiffness (ICPS) risk categories on cardiovascular (CV) mortality in end-stage renal disease (ESRD) patients.
Methods: This is a secondary analysis of a prospective study of 91 ESRD patients on hemodialysis therapy. At baseline, pulse wave velocity (PWV), central systolic blood pressure (cSBP) and central pulse pressure (cPP) were measured and patients were followed up for CV mortality for a median 29.5 months. Based on the shape of the association of each individual ICPS parameter with the CV outcome, patients were assigned ICPS scores: one point was given, if either the cSBP value was in the 3rd, or if the PWV or cPP was in the 2nd or 3rd tertiles (ICPS range: 0–3). We then evaluated the role of ICPS risk categories (average: 0–1, high: 2, very high: 3 points) in the prediction of CV outcomes using Cox proportional hazard regression analysis and compared its discrimination (Harrell’s C) to that of each of its components.
Results: We found a strong dose–response association between ICPS risk categories and CV outcome (high risk HR = 2.62, 95% CI: 0.82–8.43, p for trend = 0.106; very high risk HR = 10.03, 95% CI: 1.67–60.42, p = 0.02) even after adjustment for multiple potential confounders. ICPS risk categories had a modest discrimination (C: 0.622, 95% CI: 0.525–0.719) that was significantly better than that of cSBP (dC: 0.061, 95% CI: 0.006–0.117).
Conclusion: The ICPS risk categories may improve the identification of ESRD patients with high CV mortality risk.
HIGHLIGHTS
- •
Integrated evaluation of central blood pressure and stiffness (ICPS) may improve risk prediction.
- •
ICPS risk categories were developed and tested in end-stage renal disease (ESRD).
- •
Very high ICPS risk category is a strong predictor of cardiovascular mortality in ESRD.
- •
- Copyright
- © 2019 Association for Research into Arterial Structure and Physiology. Publishing services by Atlantis Press International B.V.
- Open Access
- This is an open access article distributed under the CC BY-NC 4.0 license (http://creativecommons.org/licenses/by-nc/4.0/).
1. INTRODUCTION
Cardiovascular (CV) diseases are the leading causes of morbidity and mortality in industrialized countries worldwide, despite the availability of highly effective preventive treatments. This phenomenon is even more pronounced in chronic kidney disease (CKD), especially in end-stage renal disease (ESRD), as CV mortality of patients on maintenance hemodialysis (HD) is more than 10-fold higher compared with the normal population [1]. Therefore, attempts in ESRD to better identify high risk patients and their more effective prevention have an outmost importance.
In the past two decades numerous investigations demonstrated that aortic stiffening as measured by carotid-femoral Pulse Wave Velocity (PWV) predicts mortality independently of traditional risk factors. The most striking effect was observed in ESRD patients on maintenance HD, in whom a 3.4 m/s increase in PWV was associated with a threefold rise in the risk for mortality [2]. Based on the accumulating evidence regarding the role of PWV in the prediction of target organ damage, PWV was assigned as IIa recommendation in the European hypertension guidelines in 2007 and 2013 [3,4]. In contrast, the 2016 the European guideline on CV risk prevention advised against its use for CV risk assessment in the general population [5] and in the most recent European hypertension guideline the level of recommendation was downgraded to IIb [6]. Given these ups and downs, it seems that the scientific audience is currently less convinced about the usefulness of the measurement of arterial stiffness for CV risk stratification compared to the beginning of the century.
Arterial stiffness can be measured by several methods [7,8]. With most of the available devices parallel with the measurement of PWV, other parameters can also be evaluated, which correlate with PWV and each other, but also reflect on different features of the vasculature. Such parameters are the central systolic blood pressure (cSBP) reflecting on pressure; central pulse pressure (cPP) reflecting on pulsatility; and augmentation index (AIx) reflecting on wave reflection. Recently, we developed an integrated central blood pressure-aortic stiffness (ICPS) risk score and based on it defined three ICPS risk categories in CKD patients on conservative therapy. ICPS risk categories were very strong predictors of CV outcome in CKD patients showing superiority over PWV [9].
In the present study our aim was to test the association between ICPS risk score and ICPS risk categories and CV mortality in a cohort of ESRD patients on HD therapy. We hypothesized that ICPS risk categories would be similarly good predictors of CV outcome in ESRD patients on HD therapy as it was found in CKD patients on conservative therapy.
2. MATERIALS AND METHODS
2.1. Participants and Setting
The details of the methods of this retrospective cohort study were published previously [10–13]. In brief, patients were recruited among ambulatory, chronic (>3 months on HD) ESRD patients of two HD units of a dialysis network. None of the patients were hospitalized at the time of baseline investigations. Patients with atrial fibrillation were excluded, but otherwise all those patients, who gave written informed consent for participation, were included. Patients were considered to have established CV disease if they had a documented history of myocardial infarction, revascularization procedure, stroke or peripheral artery disease. After baseline clinical, laboratory, arterial stiffness and central hemodynamic measurements, patients were followed for a median of 29.5 months (interquartile range: 1–51). Follow-up data were collected between March 2005 and June 2009. All endpoint information was verified by original chart review. Outcome measure was death from a CV event, which was defined as documented myocardial infarction, stroke, heart failure, malignant arrythmia leading to death or sudden cardiac death. The protocol was approved by the Ethics Committee of the dialysis network and was carried out in accordance with the tenets of the Declaration of Helsinki.
2.2. Arterial Stiffness, Central Hemodynamic and Blood Pressure Measurements
All measurements were performed before a midweek HD session, with the patient in the supine position in a temperature-controlled room (24 ± 1°C). Arterial stiffness measurements and predialysis blood sampling were done on separate days within a week.
PWV, AIx, cSBP and cPP were measured by applanation tonometry (PulsePen device; DiaTecne s.r.l. Milan, Italy [14]) using sequential recordings of the arterial pressure wave at the carotid and femoral arteries, and by measurement of the distance between the carotid and the femoral sampling sites. Since current recommendation suggests the use of 80% of the direct carotid-femoral distance as the most accurate proxy of the numerator for PWV measurement, our previous data were recalculated accordingly [15].
All the measured parameters were calculated using the PulsePen software [14]. PWV was defined as the ratio of the distance and the transit time of the pulse pressure wave along the aorta between the sampling sites. Pulse wave amplitude was calibrated to brachial mean and diastolic pressure measured immediately prior to each sequence of pulse wave capture at the two sites. Recordings with a systolic or diastolic variability of consecutive waveforms above 10% or with the amplitude of the pulse wave signal being <80 mV were discarded. All measurements were done three times and their average was used in the calculations. cSBP was calculated directly from the carotid pulse waveform using the calibration considering brachial systolic and diastolic blood pressures. cPP was calculated as the difference between the highest central systolic and diastolic blood pressure values recorded at the carotid sampling site. AIx was measured by automatic identification of the ‘1st shoulder’ (inflexion point) on the averaged carotid pulse signal by the PulsePen software. The pressure amplitude following this point divided by the pulse pressure provided the AIx.
Blood pressure and heart rate were recorded in supine position after each arterial stiffness measurement with a validated BpTru device (VSM Medtech, Vancouver, Canada). The two sequential measurements were manually averaged.
2.3. ICPS Score and Risk Categories
To calculate the ICPS score one point was given, if a patient’s cSBP was in the 3rd tertile and if PWV or if cPP were in the 2nd or 3rd tertiles. The ICPS score was derived by summing these points (range: 0–3 points).
Given the limited statistical power of our relatively small sample size, the number of risk categories was further reduced and patients were classified into three ICPS risk categories: average (0–1 points), high (2 points) or very high (3 points).
2.4. Epidemiologic and Laboratory Data
Baseline data on current smoking, type and presence of diabetes mellitus, hypertension, coronary artery disease (previous acute myocardial infarction or coronary intervention), chronic heart failure (clinical diagnosis), peripheral arterial disease (documented by angiography or intervention) and cerebrovascular disease (previous stroke or transient ischemic attack) were collected by health record review. Patients were considered to have established CV disease if they had a documented history of myocardial infarction, revascularization procedure, stroke or peripheral arterial disease.
Blood samples for the determination of blood cell counts and hemoglobin, serum cholesterol, triglyceride, LDL-cholesterol, ions, albumin, parathormone and 25-OH vitamin D were collected at baseline. Routine blood chemistry measurements were done on a Hitachi auto-analyzer, (Japan Care Co. Ltd., Osaka, Japan).
2.5. Statistical Analysis
All data analyses were performed using SPSS 22 for Windows (IBM Ltd., USA) or Stata version 13.1 (StataCorp LLC, USA). Continuous data are given as mean and standard deviation, or in case of evidence against a normal distribution, as a median and interquartile range. In general, the flow of statistical analysis followed our previous report [9].
Arterial stiffness and central hemodynamic parameters were analyzed both as continuous and categorical variables. For the former, these variables were transformed into z-scores to improve their comparability and thus the associations are given for one SD differences in PWV, AIx, cSBP and cPP for the CV outcome (Cox regression). Model 1 was unadjusted, while Model 2 was adjusted for age, sex, brachial SBP, LDL-cholesterol, current smoking, diabetes, body mass index and history of CV disease.
Survival was investigated with Kaplan–Meier and Cox regression analyses with ICPS score as the predictor and CV mortality as outcome. The predictive role of ICPS risk categories were investigated in Kaplan–Meier curves and Cox regressions with adjustment for age, sex, brachial SBP, LDL-cholesterol, current smoking, diabetes, body mass index and cardiovascular disease.
Finally, to compare the predictive value of the ICPS risk categories and each of its components (PWV, cSBP and cPP), all parameters were sequentially entered into a Cox-regression model with CV mortality as outcome. To investigate and compare discrimination of the different stiffness measures, Harrell’s concordance (Harrell’s C)-statistics were calculated.
3. RESULTS
Altogether 126 chronic HD patients at the two dialysis units were invited to participate. Of these, 28 patients declined participation and seven were excluded because of atrial fibrillation leaving 91 patients for the analytical sample.
Table 1 displays baseline characteristics including dialysis duration, concomitant diseases, traditional CV risk factors, primary renal disease leading to ESRD, laboratory and hemodynamic parameters.
| Subjects, n | 91 |
| Sex (male, %) | 56 (61.5) |
| Age (years) | 63.3 (14.8) |
| Dialysis duration (months) | 29.5 (13.7–33.6) |
| Residual dialysis (ml/day) | 650 (100–1300) |
| BMI (kg/m2) | 25.2 (4.5) |
| Smoking, n (%) | 17 (18.7) |
| Diabetes, n (%) | 38 (41.6) |
| CV disease, n (%) | 55 (60.4) |
| Primary renal disease, n (%) | |
| Diabetic | 31 (34.1) |
| Hypertensive | 17 (18.7) |
| Tubulo-interstitial | 14 (15.3) |
| Glomerulonephritis | 13 (14.3) |
| Polycystic | 6 (6.6) |
| Other or unknown | 10 (11.0) |
| Laboratory results | |
| Haemoglobin (g/l) | 116.0 (103.0–123.0) |
| Creatinine (μmol/l) | 650.0 (516.0–834.0) |
| Blood urea nitrogen (mmol/l) | 19.6 (16–24.5) |
| Cholesterol (mmol/l) | 4.5 (1.2) |
| HDL-cholesterol (mmol/l) | 1.2 (1.0–1.6) |
| LDL-cholesterol (mmol/l) | 2.5 (1.9–3.2) |
| Triglyceride (mmol/l) | 1.7 (1.0–2.7) |
| Sodium (mmol/l) | 137.0 (135.0–139.0) |
| Potassium (mmol/l) | 5.2 (0.9) |
| Calcium (mmol/l) | 2.3 (2.2–2.4) |
| Phosphate (mmol/l) | 1.6 (1.1–1.9) |
| Albumin (g/l) | 40.0 (37.6–42.0) |
| Parathormone (pmol/l) | 7.08 (3.88–18.5) |
| 25-OH vitamin D (μg/l) | 24.7 (18.7–36.5) |
| CRP (mg/l) | 6.7 (4.1–15.1) |
| Hemodynamic data | |
| Systolic blood pressure (mmHg) | 141.6 (24.7) |
| Diastolic blood pressure (mmHg) | 77.9 (13.0) |
| Heart rate (1/min) | 72.4 (12.6) |
| Pulse pressure (mmHg) | 62.5 (47.0–79.5) |
| PWV (m/s) | 11.1 (9.3–14.1) |
| Central SBP (mmHg) | 141.9 (23.3) |
| Central PP (mmHg) | 63.5 (47.0–79.0) |
| AIx (%) | 19.0 (11.0–28.5) |
Categorical parameters are presented as n, numbers can be also considered as percentage. Continuous data are presented as mean (SD) or median (interquartile range). AIx: augmentation index; BMI: body mass index; central PP: central pulse pressure; central SBP: central systolic blood pressure; PWV: carotid-femoral pulse wave velocity.
Baseline demographic, clinical, laboratory and hemodynamic characteristics of participants
Eighty-two patients received antihypertensive medication (case numbers in parentheses): renin-angiotensin system inhibitors (n = 51), calcium channel blockers (n = 58), β-receptor blockers (n = 56), α-receptor blockers (n = 28), and centrally acting antihypertensive drugs (n = 20), either alone or in combination.
In all, n = 58 patients received vitamin D and n = 72 needed calcium carbonate phosphate binder therapy.
During follow-up, 31 cardiovascular deaths were recorded: seven patients died from myocardial infarction, seven from sudden cardiac death, three from arrythmia, eight from heart failure and six from stroke.
Table 2 demonstrates the association of PWV, cSBP, cPP and AIx (per one SD difference and for each tertile) with CV mortality in unadjusted (Model 1) and in multiply adjusted models (Model 2). As a single independent variable, only PWV was significantly related to CV mortality. In the analyses by tertiles, the 2nd tertile of PWV in Model 1 and the 2nd and the 3rd tertiles of cSBP in Model 2 were related to the outcome. Unadjusted associations are shown as Kaplan–Meyer curves for each tertile of all four parameters in Figure 1. It demonstrates non-linear associations: showing an increase in the 2nd and 3rd teritle of PWV and cPP and only in the 3rd tertile of cSBP. As AIx tertiles were not related to outcome and the tertile curves crossed each other, this parameter was omitted from the ICPS score calculation.
| Variable | Model 1 | Model 2 | |||||||||
| Hazard ratio | 95% CI | p-value | Hazard ratio | 95% CI | p-value | ||||||
| PWV (per 1 SD) | 1.965 | 1.322 | 2.920 | 0.001 | 1.614 | 1.069 | 2.438 | 0.023 | |||
| cSBP (per 1 SD) | 1.223 | 0.832 | 1.798 | 0.305 | 1.162 | 0.787 | 1.716 | 0.450 | |||
| cPP (per 1 SD) | 1.345 | 0.942 | 1.920 | 0.102 | 1.066 | 0.730 | 1.556 | 0.740 | |||
| AIx (per 1 SD) | 0.967 | 0.677 | 1.381 | 0.854 | 1.431 | 0.929 | 2.203 | 0.104 | |||
| Variable | Tertile | N | Range | Hazard ratio | 95% CI | p-value | Hazard ratio | 95% CI | p-value | ||
| PWV | 1st | 30 | 4.7–9.7 | 1 (ref.) | 1 (ref.) | ||||||
| 2nd | 31 | 9.7–12.8 | 0.339 | 0.122 | 0.943 | 0.038 | 0.527 | 0.186 | 1.49 | 0.227 | |
| 3rd | 30 | 13.3–24.8 | 0.951 | 0.439 | 2.057 | 0.898 | 0.913 | 0.421 | 1.98 | 0.818 | |
| cSBP | 1st | 30 | 88.3–131.8 | 1 (ref.) | 1 (ref.) | ||||||
| 2nd | 31 | 132.5–152 | 0.540 | 0.226 | 1.287 | 0.164 | 0.066 | 0.009 | 0.502 | 0.009 | |
| 3rd | 30 | 154–200.3 | 0.524 | 0.227 | 1.213 | 0.131 | 0.141 | 0.04 | 0.494 | 0.002 | |
| cPP | 1st | 30 | 24–52.3 | 1 (ref.) | 1 (ref.) | ||||||
| 2nd | 31 | 52.5–73.3 | 0.567 | 0.226 | 1.421 | 0.226 | 0.936 | 0.365 | 2.399 | 0.89 | |
| 3rd | 30 | 73.5–114.5 | 0.859 | 0.384 | 1.923 | 0.712 | 0.982 | 0.44 | 2.193 | 0.964 | |
| AIx | 1st | 31 | −0.5–14.5 | 1 (ref.) | 1 (ref.) | ||||||
| 2nd | 30 | 15.5–23.0 | 1.020 | 0.449 | 2.315 | 0.963 | 0.449 | 0.179 | 1.122 | 0.087 | |
| 3rd | 30 | 23.5–53.5 | 0.742 | 0.298 | 1.848 | 0.522 | 0.445 | 0.175 | 1.13 | 0.089 | |
Model 1 is unadjusted, Model 2 is adjusted for age, sex, current smoking, diabetes, body mass index, cardiovascular disease, brachial systolic blood pressure and LDL-cholesterol. PWV: pulse wave velocity; cSBP: central systolic blood pressure; cPP: central pulse pressure; AIx: augmentation index; SD: standard deviation.
Cox models with cardiovascular mortality as outcome and individual arterial stiffness and central hemodynamic parameters as predictors
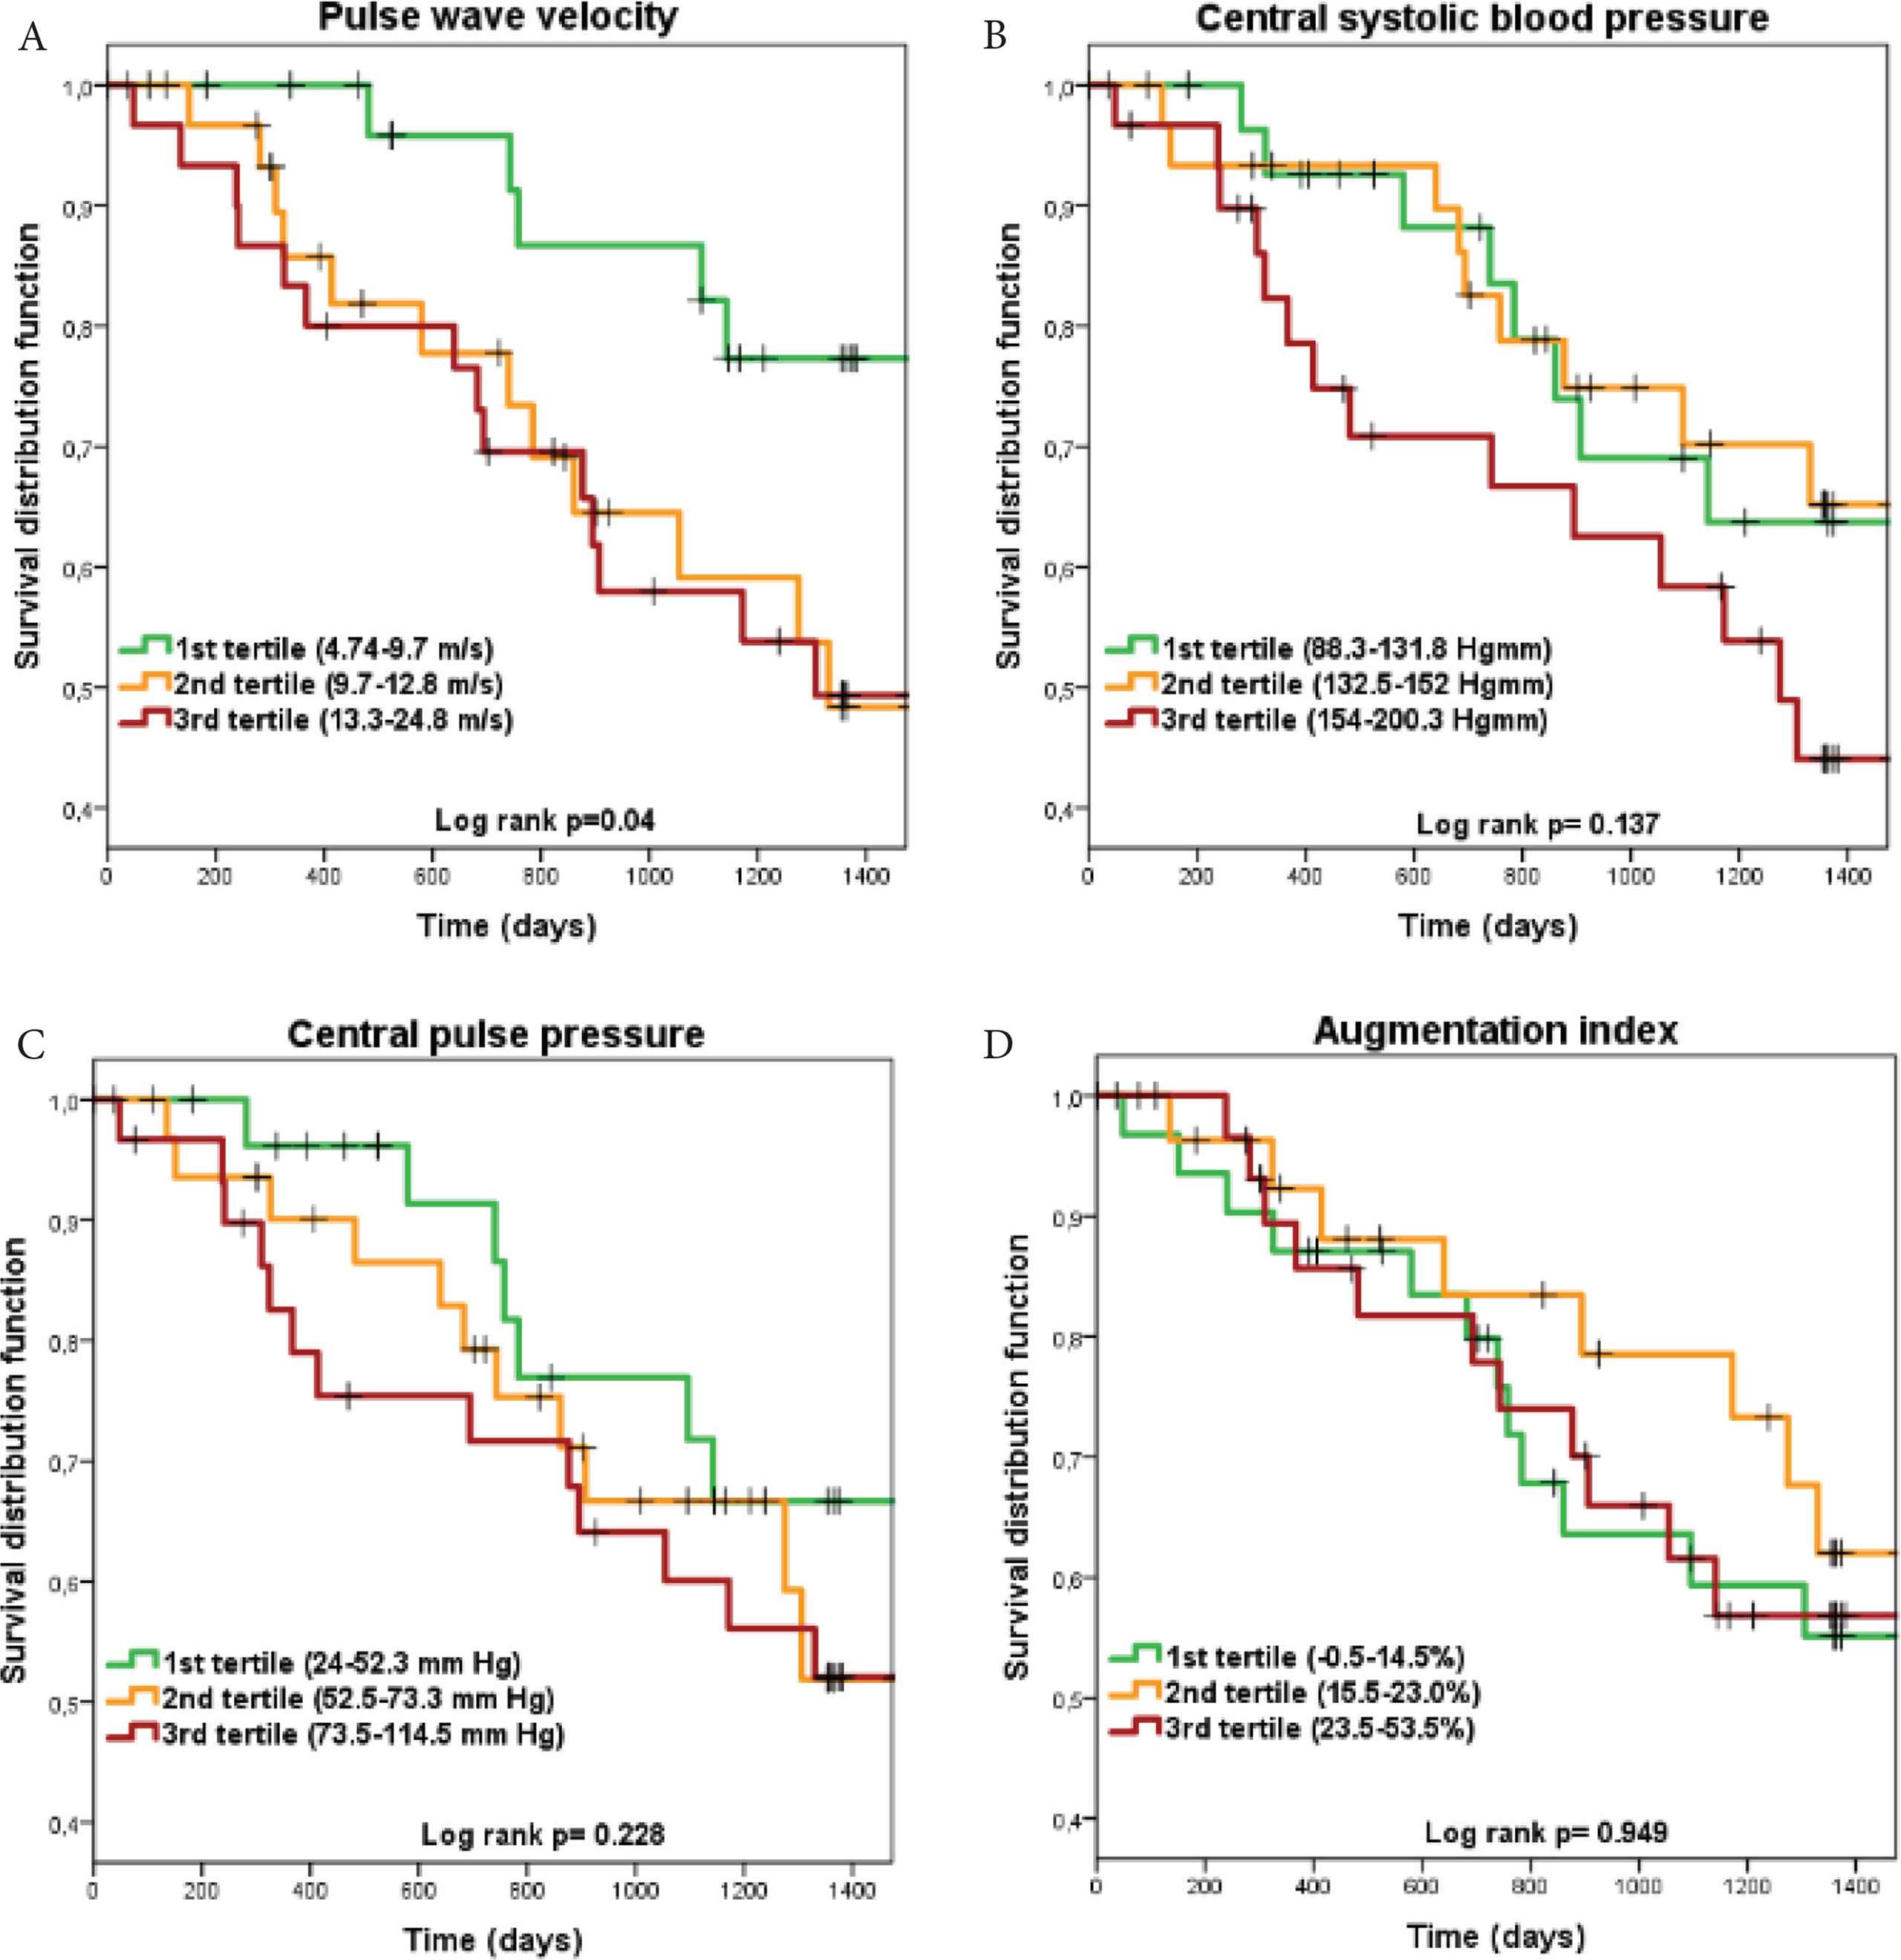
Kaplan–Meier survival curves with cardiovascular mortality as outcome for each integrated central blood pressure-aortic stiffness risk score component. Panel A: pulse wave velocity; Panel B: central systolic blood pressure; Panel C: central pulse pressure; Panel D: augmentation index.
Table 3 demonstrates hazard ratios for CV mortality by ICPS scores and risk categories. The risk categories were based on the results of the Cox-models (Table 3) and the Kaplan–Meier (Figure 2A) curves by collapsing ICPS scores with similar hazard ratios to improve statistical power. Almost two-third participants were classified into the high and very high-risk categories. Kaplan–Meier survival curves for the three ICPS risk categories are shown in Figure 2B.
| N | Hazard ratio | 95% CI | p-value | ||
|---|---|---|---|---|---|
| ICPS risk score | |||||
| Model 1 | |||||
| 0 point | 18 | 1 (ref.) | |||
| 1 point | 17 | 1.463 | 0.327 | 6.543 | 0.781 |
| 2 points | 33 | 2.323 | 0.654 | 8.246 | 0.869 |
| 3 points | 23 | 3.552 | 1.001 | 12.598 | 0.297 |
| Model 2 | |||||
| 0 point | 18 | 1 (ref.) | |||
| 1 point | 17 | 0.668 | 0.131 | 3.399 | 0.627 |
| 2 points | 33 | 2.112 | 0.410 | 10.886 | 0.371 |
| 3 points | 23 | 10.126 | 1.056 | 97.110 | 0.045 |
| ICPS risk categories | |||||
| Model 1 | |||||
| Average | 35 | 1 (ref.) | |||
| High | 33 | 1.902 | 0.748 | 4.837 | 0.177 |
| Very high | 23 | 2.910 | 1.145 | 7.396 | 0.025 |
| Model 2 | |||||
| Average | 35 | 1 (ref.) | |||
| High | 33 | 2.622 | 0.816 | 8.432 | 0.106 |
| Very high | 23 | 10.034 | 1.666 | 60.425 | 0.012 |
Model 1 was unadjusted, while Model 2 was adjusted for age, sex, brachial systolic blood pressure, LDL-cholesterol, current smoking, diabetes, body mass index and CV disease.
The relation of integrated central blood pressure-aortic stiffness (ICPS) risk score and ICPS risk categories with cardiovascular mortality based on Cox proportional hazard regression models
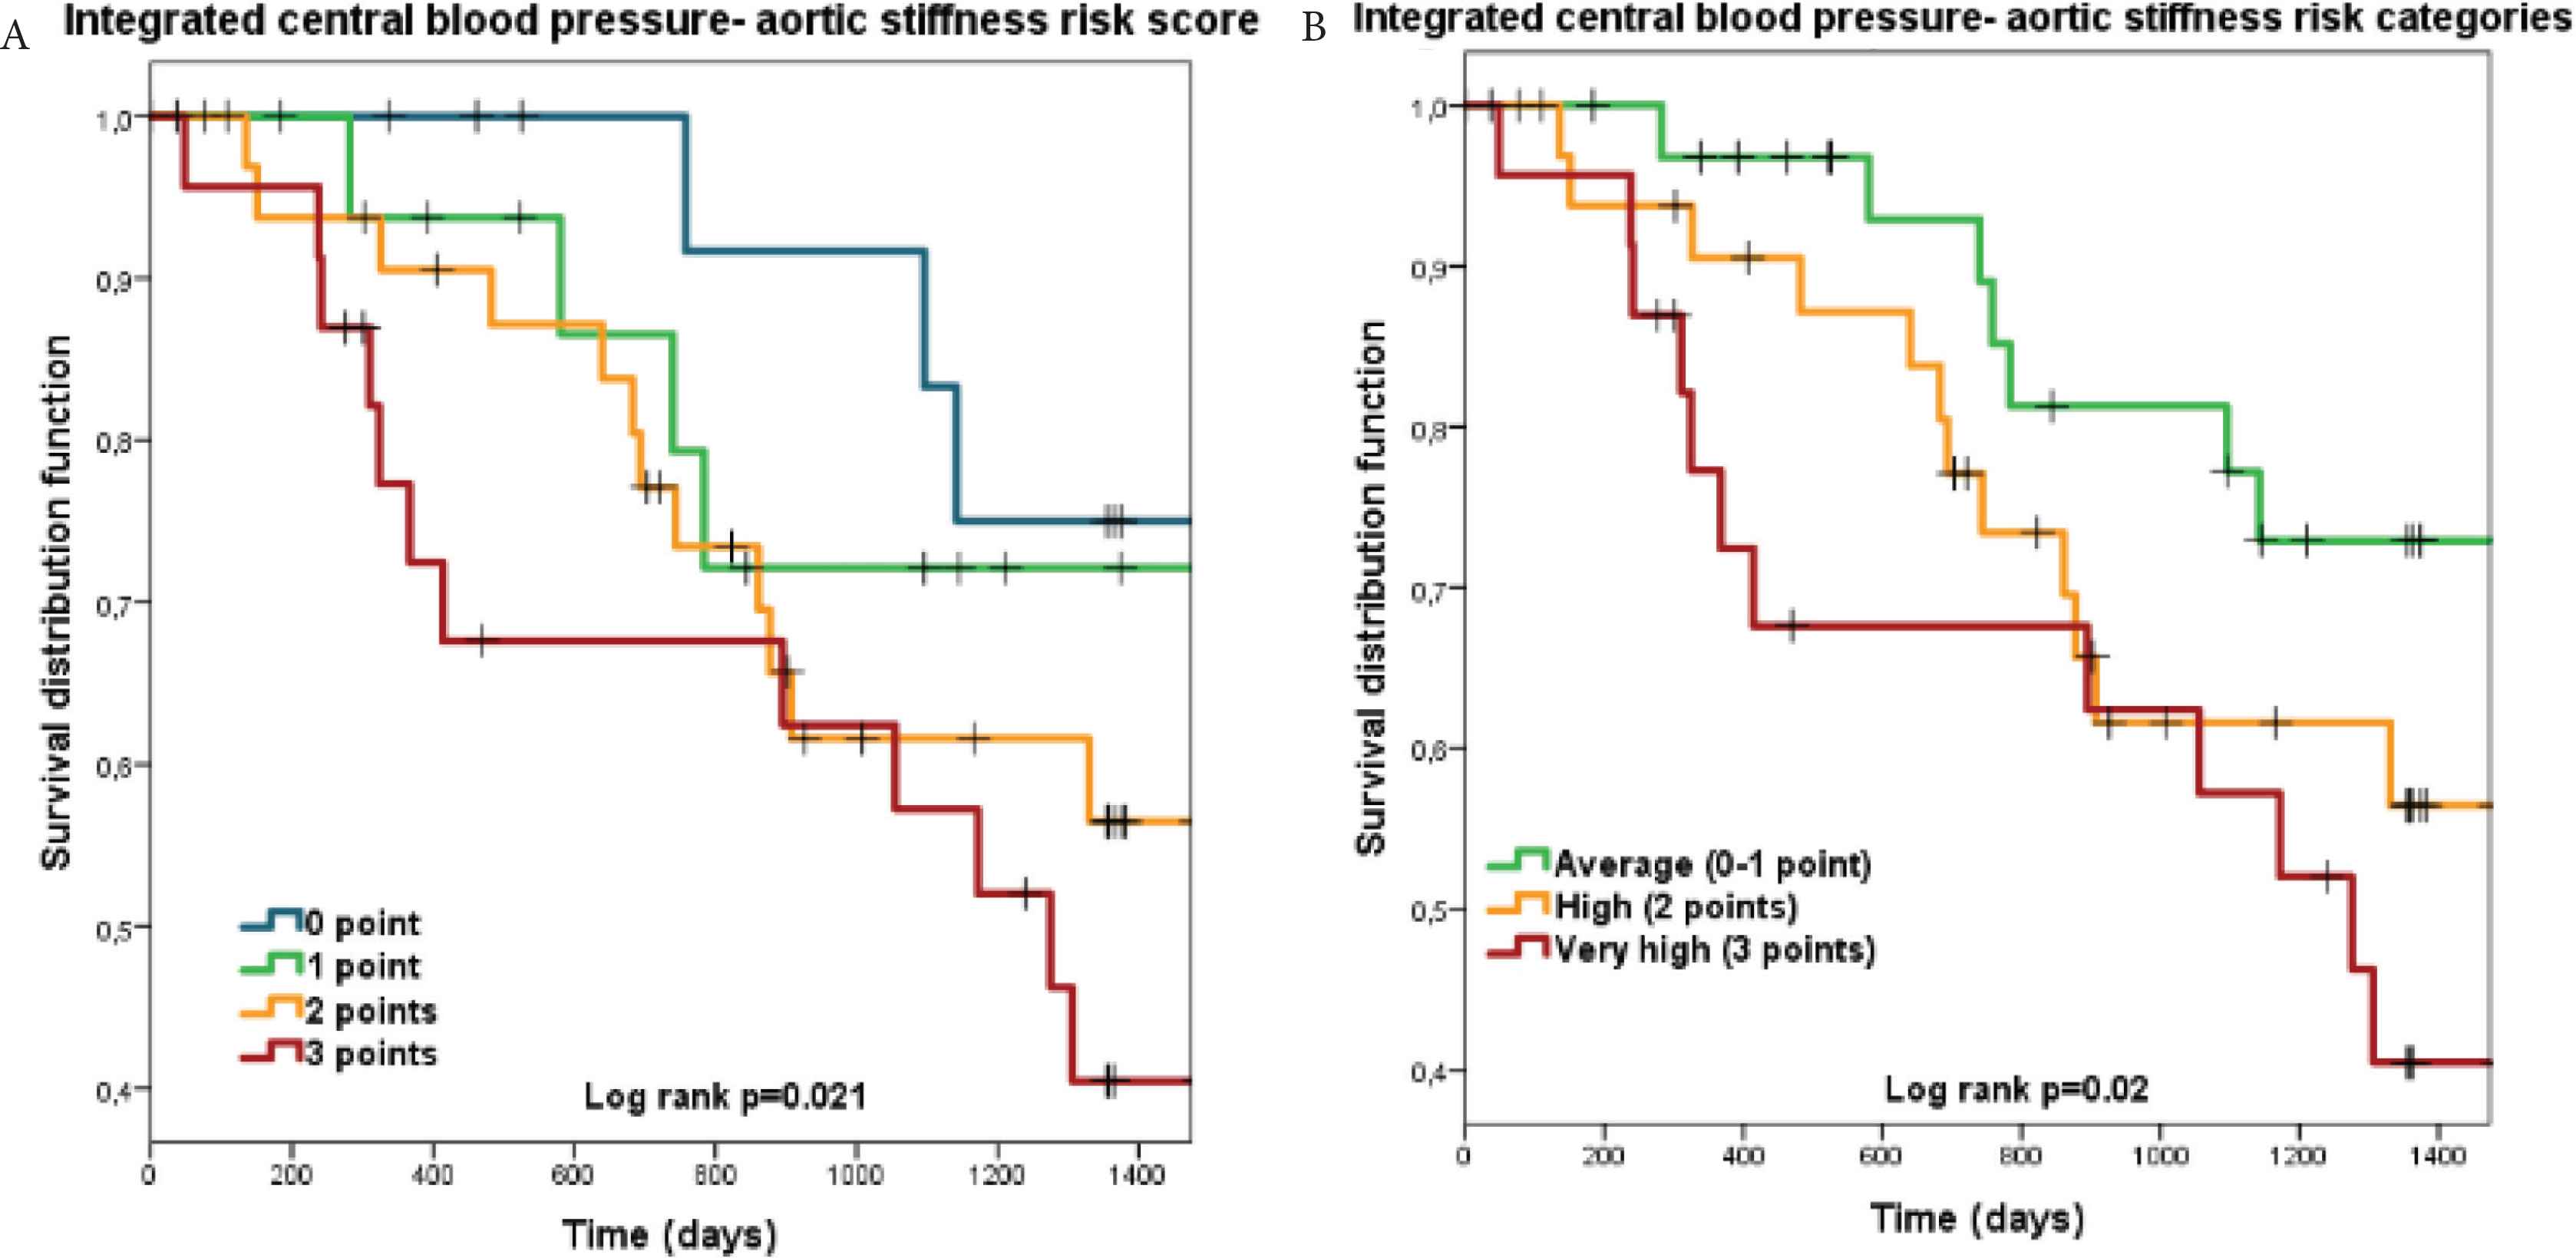
Kaplan–Meier survival curves for the integrated central blood pressure-aortic stiffness (ICPS) risk scores and ICPS risk categories for cardiovascular mortality as outcome. Panel A: ICPS risk score groups; Panel B: ICPS risk categories.
Table 3 shows that participants in the very high ICPS risk category had a substantially increased CV mortality risk and also a stepwise increase from average through high to very high risk after adjustment for multiple CV risk factors. In Model 2, besides the very high ICPS risk category older age (HR: 1.05, 95% CI: 1.01–1.09) and lower systemic systolic blood pressure (HR: 0.97, 95% CI: 0.94–1.00) remained independent predictors of CV mortality.
Table 4 shows C-statistics (and differences between C-statistics) for ICPS risk categories and PWV, cSBP, and cPP. All C-values show moderate discrimination, however discrimination by ICPS risk categories was superior to that of cSBP. A tendency may also be seen in the case of cPP, while ICPS risk categories and PWV had similar C-statistics.
| Variable | Coefficient | Standard error | 95% CI | p-value | |
|---|---|---|---|---|---|
| ICPS risk categories | 0.622 | 0.049 | 0.525 | 0.719 | <0.001 |
| PWV | 0.662 | 0.052 | 0.558 | 0.766 | <0.001 |
| cSBP | 0.561 | 0.052 | 0.456 | 0.665 | <0.001 |
| cPP | 0.588 | 0.05 | 0.489 | 0.687 | <0.001 |
| ICPS risk categories vs. PWV | −0.04 | 0.051 | −0.142 | 0.062 | 0.438 |
| ICPS risk categories vs. cSBP | 0.061 | 0.028 | 0.006 | 0.117 | 0.031 |
| ICPS risk categories vs. cPP | 0.034 | 0.028 | −0.022 | 0.089 | 0.226 |
Bold values demonstrate significance when p < 0.05. CI: confidence intervals; ICPS risk categories: integrated central pressure-stiffness risk categories; PWV: carotid-femoral pulse wave velocity; cSBP: central systolic blood pressure; cPP: central pulse pressure.
Harell’s C-statistics for ICPS risk categories and arterial stiffness measures and the differences in the C-statistics between ICPS risk categories and arterial stiffness measures
4. DISCUSSION
Our study demonstrated that integrated risk categories based on arterial stiffness and central hemodynamic parameters (ICPS) are related to cardiovascular mortality not only in conservatively treated CKD patients but also in ESRD patients on HD therapy. According to our results, people in the very high ICPS risk category have a remarkably elevated risk of CV mortality, while patients in the high risk category have intermediate risk. ICPS risk categories had a better discriminative ability for CV mortality than cSBP by itself, had a numerically higher C-statistics that cPP and similar discrimination to that of PWV.
Recently, we introduced an ICPS risk score and derived three ICPS risk categories based on it, there were strong predictors of CV events in CKD patients on conservative therapy [9]. In that cohort participants in the high ICPS risk category had a significantly elevated CV risk compared with the average risk group. We believe this is due to the limited power of the present study as the number of events during the follow-up was lower in the ESRD compared with the CKD cohort (n = 31 vs. n = 49) [9].
In our CKD cohort the ICPS risk categories showed superior discrimination over PWV in the prediction of CV events [9], while it was similar in the present ESRD cohort. This is probably due to the fact, that PWV is a much stronger predictor of CV outcomes in ESRD patients on HD compared with that in CKD patients on conservative therapy [2]. This latter hypothesis is supported by our previous report on the CKD cohort [16]. This phenomenon is probably due to the accelerated vascular calcification in dialysis patients, which is strongly associated with mineral-bone disorder [17] and eventuates in elevated arterial stiffness and PWV.
As we highlighted in our previous manuscript, there are multiple potential advantages of the ICPS score concept over the use of its individual components. The required parameters can easily be estimated with most of the commercially available devices, its determination is non-invasive as it requires no blood sampling and it also can bridge the divergent methodologies [9]. A recently published study also supports our concept. Niiranen et al. [18] assessed the prognostic value of the joint evaluation of central pulse pressure and carotid-femoral pulse wave velocity by dividing the population into high and low risk groups based on the categorization of the medians of these values in the Framingham Heart Study. They have found, that patients in “high/high” group had a 52% higher risk of CV events compared with the low/low group [18]. Unfortunately in this study the discriminative ability of this simple categorization was not compared with that of its components.
As the present definition of ICPS risk categories is based on a limited sample, we do not recommend its calculation using the cut-off values from our sample in the general population, not even in ESRD patients on hemodialysis. A valid risk score should be based on much larger samples with an adequate number of CV events that enables the investigation of each parameter involved in the score [19]. However, as our ICPS risk categories in the present simplified form are strong predictors of CV mortality in our cohort, we believe that our pilot report could generate important discussion and further studies.
There are some limitations of our study that has to be acknowledged. As patients with atrial fibrillation are ineligible for tonometric arterial stiffness measurements, they were excluded from the present analysis, the ICPS score cannot be calculated for a substantial proportion of ESRD patients. Due to the low number of participants and events, our study is underpowered and thus the exact thresholds used for scoring or the relative contribution of each components cannot be exactly defined. Given these limitations, our aim with the present report is not to define the final score but to introduce the concept of a combined risk score based on arterial stiffness and central hemodynamic parameters and highlight some of its potential advantages.
In conclusion, our integrated score and the ICPS risk categories derived from it showed a strong association with CV mortality in ESRD patients on hemodialysis therapy. Our findings highlight the potential for a combined measure of arterial stiffness and central hemodynamic parameters for CV prediction. Together with our previous results of CKD patients on conservative therapy, this is the second independent cohort where our new concept demonstrated promising results.
CONFLICTS OF INTEREST
The authors declare they have no conflicts of interest.
AUTHOR CONTRIBUTIONS
DB and BK were involved in data curation and visualization. ÁT, BK and JN were involved in formal analysis and writing (review and editing). OC and JE were involved in investigation. OC, JE and JN were involved in methodology. AT and JN were involved in study conceptualization. AT supervised the project. JN was involved in writing (original draft).
ACKNOWLEDGMENTS
This study was supported by research grants from the
Footnotes
REFERENCES
Cite this article
TY  - JOUR
AU  - Dóra Batta
AU  - Ádám Tabák
AU  - Beáta Kőrösi
AU  - Orsolya Cseprekál
AU  - József Egresits
AU  - András Tislér
AU  - János Nemcsik
PY  - 2019
DA  - 2019/11/24
TI  - Integrated Central Blood Pressure-aortic Stiffness Risk Categories and Cardiovascular Mortality in End-stage Renal Disease
JO  - Artery Research
SP  - 49
EP  - 55
VL  - 25
IS  - 1-2
SN  - 1876-4401
UR  - https://doi.org/10.2991/artres.k.191114.004
DO  - 10.2991/artres.k.191114.004
ID  - Batta2019
ER  -